Linear Regression and the Correlation Coefficient (Math 1)
Secondary Math Materials
35 Followers
Grade Levels
6th - 12th
Subjects
Resource Type
Standards
CCSSHSS-ID.B.6
CCSSHSS-ID.B.6a
CCSSHSS-ID.B.6c
Formats Included
- Zip
Pages
9 slide SMART Presentation; 2 page Note-Taking guide
Secondary Math Materials
35 Followers
Description
This lesson is the fifth of six lessons in the Math 1 Statistics Unit.
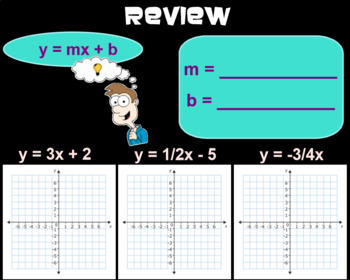
This lesson includes important vocabulary, examples (guided practice), and class work (independent practice). At the end of the presentation is a Ticket Out the Door that can be used as a formative assessment.
There is a note-taking guide for the students to fill out as the teacher goes through a SMART Notebook presentation.
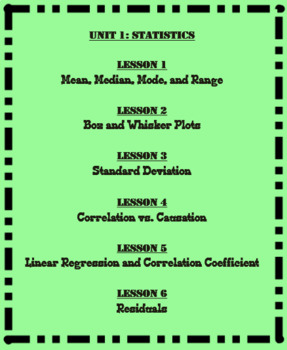
Unit 1: Statistics
Lesson 1: Mean Median Mode Range Outliers and Skew
Lesson 2: Box and Whisker Plots
Lesson 3: Standard Deviation
Lesson 4: Correlation vs Causation
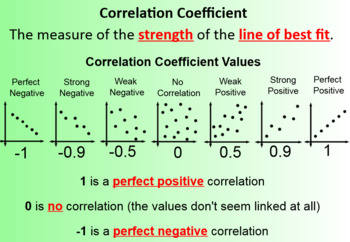
Lesson 5: Linear Regression and the Correlation Coefficient
Lesson 6: Residuals
Total Pages
9 slide SMART Presentation; 2 page Note-Taking guide
Answer Key
Included
Teaching Duration
90 minutes
Report this resource to TPT
Reported resources will be reviewed by our team. Report this resource to let us know if this resource violates TPT’s content guidelines.
Standards
to see state-specific standards (only available in the US).
CCSSHSS-ID.B.6
Represent data on two quantitative variables on a scatter plot, and describe how the variables are related.
CCSSHSS-ID.B.6a
Fit a function to the data; use functions fitted to data to solve problems in the context of the data.
CCSSHSS-ID.B.6c
Fit a linear function for a scatter plot that suggests a linear association.


