1,538 results
11th grade graphing microsofts

Beaker Pong: Experimental Design and Graphing Lab, NGSS aligned
Great 1st week or 1st month STEM activity! All parts are EDITABLE and includes a graphing grid! This is a great way to introduce the "science process" (better phrase for scientific method) at the start of a semester or anytime you want fun to occur in your classroom.*****Focus on the NGSS PRACTICES Dimension*****The National Research Council's (NRC) Framework describes a vision of what it means to be proficient in science; it rests on a view of science as both a body of knowledge and an evidenc
Subjects:
Grades:
7th - 12th
Types:
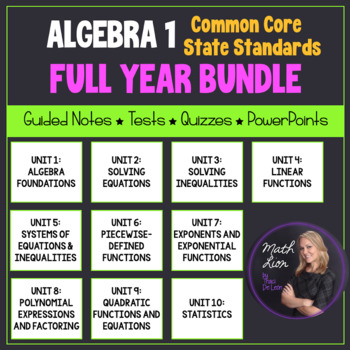
Algebra 1 Curriculum - Full Year EDITABLE Unit Plans | Bundled for Common Core
This is a great bundle that covers concepts for a full year Algebra 1 course! 76 lessons are included! Documents are EDITABLE!Included:- Overview of the common core alignment tandards (Two 18-week guides) (PDF and Word) - Overview of the common core alignment (PDF)- Guided notes for 76 lessons (PDF and Word)- PowerPoint presentations (aligned with guided notes) (PPTX)-10 Mid-unit quizzes (PDF and Word)-10 Unit tests (PDF and Word)-2 Semester exams (PDF and Word)Each lesson contains a learning
Grades:
8th - 12th
CCSS:
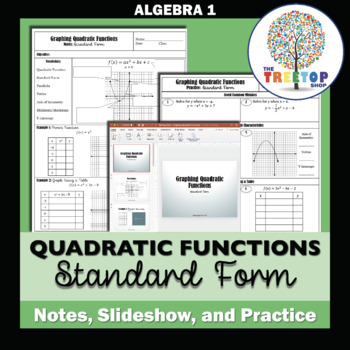
Graphing Quadratic Functions (Standard Form) - Notes, Slideshow, and Practice
Students will:-Identify key features of graphs of quadratic functions.-Graph quadratic functions in standard form using a table of values.-Graph quadratic functions from standard form by finding the axis of symmetry, vertex, and y-intercept.Includes everything you need to teach this lesson in one folder:-PDF of guided notes (with key)-Editable PowerPoint and Google Slide presentation for use with guided notes-PDF of practice problems (with key)Copy the guided notes for students and present the l
Subjects:
Grades:
9th - 12th
CCSS:
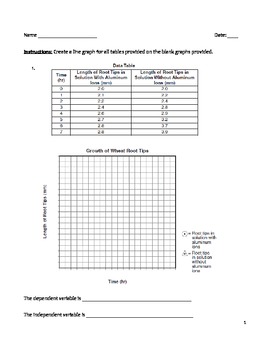
High School Science Graphing Worksheet - Making Line Graphs in Science
Use this worksheet to help your students practice making line graphs. In addition, they will have to identify both the independent and dependent variables. Hopefully, they will make the connection between the variables and their placement on the graph. There is a key provided for the teacher. There are ten line graphs for students to work with.
line graph, plot points, independent variable, dependent variable, data table, uniform scale, x-axis, y-axis
Subjects:
Grades:
8th - 12th
Types:
Blank Bar Graph/Double Bar Graph Template
This is a bar graph template that can be used by teachers to teach students how to understand bar graphs and create their own bar graphs. Teachers can use this template teach students about parts of a bar graph and how to interpret data in bar graphs.
Grades:
1st - 12th
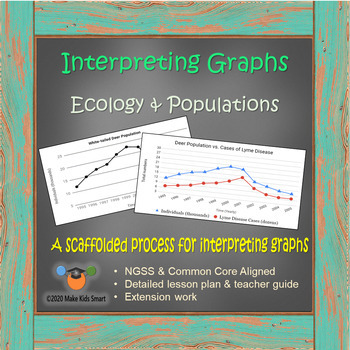
Interpreting Graphs - Ecology & Populations (17 slide Distance Learning Packet)
Teach students how to analyze and interpret line graphs, describe trends, and discuss data using a proven 5-step process. This is 2-3 periods of work suitable for distance learning and meant to move gradually from teacher led to independent work.All materials are found within this 17 page editable power point which is suitable for distance learning. Slides can be shared individually for student completion or shared as a full packet.Please check the preview to see exactly what you are downloading
Subjects:
Grades:
6th - 12th
NGSS:
HS-LS2-7
, MS-LS2-2
, MS-LS2-5
, HS-ESS3-2
, MS-LS2-4
...
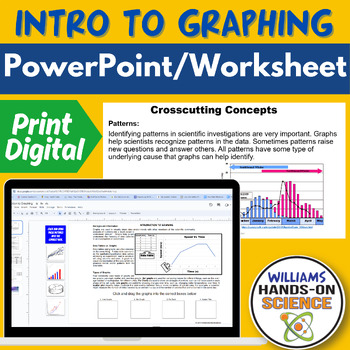
NGSS Intro to Graphing Crosscutting Concepts Science & Engineering Practices
If you are teaching your students how to understand graphs and want to hit NGSS Science and Engineering Practices and Crosscutting Concepts, this resource is a great scaffold or lecture! This resource is great as a warm up/bell ringer, lecture, homework or sub plan.This resource includes the following:-Student Handout-Key-Editable PowerPoint for lecture and/or scaffold This resource includes the following Concepts:-Interpreting Graphs-How to make a graph-Difference between data tables and graph
Subjects:
Grades:
6th - 12th
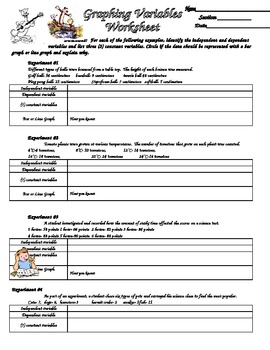
Scientific Method Variables and Graphing Practice
Students are given six different sets of experimental data and asked to identify the variables (independent, dependent etc.). They also reinforce graphing by identifying if the data should be represented with a bar or line graph. With this information, students the create data tables and graphs for the data.
Subjects:
Grades:
3rd - 12th
Types:
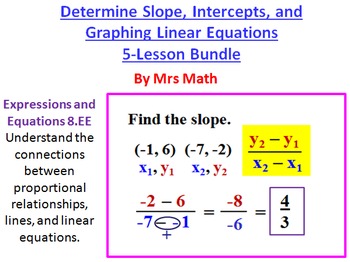
Slope, Intercepts, and Graphing Linear Equations Power Point 5 Lesson Pack
PDF and Microsoft word versions included.Are you looking for an all inclusive package that has everything you need to teach finding the slope, intercepts, and graphing equations? This is it! Lesson Power Points, classworks, homeworks, quizzes, a set of test questions, and even some teaching tips embedded in the lesson for instruction. If you are teaching this topic from scratch these resources will be a lifesaver. They can also be an excellent supplement to the resources you are already usin
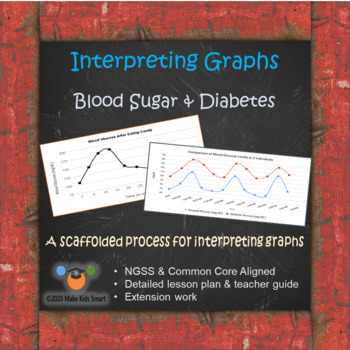
Interpreting Graphs - Blood Sugar & Diabetes (15 slide Distance Learning PPT)
Teach students how to analyze and interpret line graphs, describe trends, and discuss data using a proven 5-step process. This is 2-3 periods of work suitable for distance learning and meant to move gradually from teacher led to independent work. All materials are found within this 15 page editable power point which is suitable for distance learning. Slides can be shared individually for student completion or shared as a full packet.Please check the preview to see exactly what you are downloa
Grades:
6th - 12th
CCSS:
NGSS:
MS-LS1-2
, MS-LS1-3
, HS-LS1-2
, HS-LS1-3

The Scientific Method-Red-Nosed Reindeer Mystery-Christmas-Powerpoint
Follow Roger the elf as he applies the Scientific Method to question the origin of the red-nosed reindeer.
Terms/Topics covered in this presentation include: The Seven Steps of the Scientific Method, How to Applying the Scientific Method, hypothesis, variables, controls, data, Recording and Analyzing Data, Data tables, Graphing, Drawing Scientific Conclusions, and hidden variables.
This would be a great review, but can also be a stand alone lesson. Aside from providing an entertaining a
Subjects:
Grades:
4th - 12th
Create Population Pyramids!
OverviewStudents will understand how to read a population pyramid by creating one! This activity includes two templates to help your students create their own population pyramids, as well as population data for four countries from the U.S. Census Bureau's International Database. The activity includes blank cards if you or your students would like to create additional or specific population pyramids. Instructions are included to help navigate the U.S. Census Bureau's website in order to obtain th
Grades:
6th - 12th
Types:
Pasta Activity - An Introduction to Graphing Sine and Cosine
This activity introduces graphing sine and cosine functions in a fun way! By using uncooked pasta, students will use the unit circle to discover the shape, amplitude, and period of the sine and cosine graphs.
The PowerPoint walks students through the activity and illustrates the shape of the graph on sine and cosine, amplitude and period and concludes with discussion questions.
Subjects:
Grades:
9th - 12th
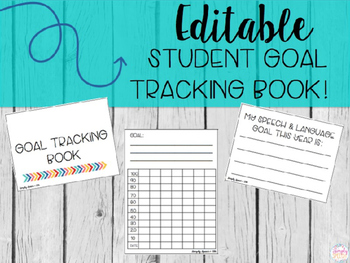
Editable Student Goal Tracking Book
These mini goal books are the perfect way to help your students keep track of their own goals. These books help increase student motivation and self awareness as they create their own personal goals and track their own progress.Here's what's included:Page 3: cover page options. This page is editable. Click on 'add text box' to add your students' names to their books.Page 4: Goal tracking sheets. Print as many of these pages as you need. This is also editable if you wish to type the goals in. Pag
Subjects:
Grades:
1st - 12th
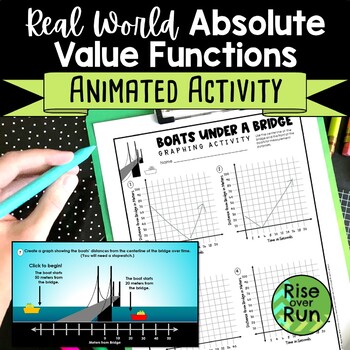
Real World Absolute Value Functions Activity
Challenge students to use absolute value graphs and equations for modeling real world situations! In the animated PowerPoint provided, students watch boats move across the screen and under a bridge. Using a stopwatch (or their phones), they time the movements. They create a graph showing each boat’s distance from the bridge. Then they determine each function and x-intercept (or when the boat passes under the bridge). 8 animations are provided. They begin simple but progress in difficulty. This
Subjects:
Grades:
9th - 12th
CCSS:
Also included in: Algebra 1 and 8th Grade Math Curriculum Bundle for Entire Year
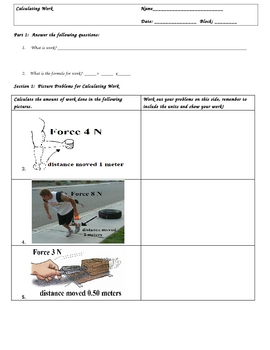
Calculating Work (W=Fxd) Worksheets and Key
Calculating Work (W=Fxd) Worksheets and KeyIf you have been teaching a Simple Machines or Energy Unit, then you need to check out this three page lesson to teach calculating work. It is in three sections.Section 1: Picture QuestionsSection 2: Word Problems/with Challenge QuestionsSection 3: Charting/Graphing ProblemsAll problems are worked out and the key is included.These worksheets include the renown Triangle Method, which has been a proven problem solver for students who struggle in math.The
Subjects:
Grades:
3rd - 12th, Higher Education, Adult Education
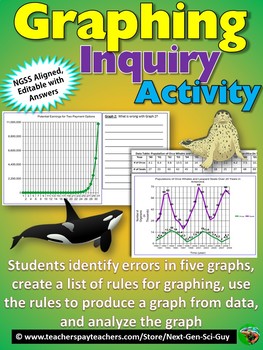
Graphing Inquiry Activity: NGSS Graphing and Data Analysis: Distance Learning
This activity proceeds as follows:1. Students are given a hypothetical scenario in which they are offered two different payment options for house-sitting a wealthy neighbor's house, and have to fill in a data table by calculating the earnings for each option 2. Students then evaluate five different graphs, each of which incorrectly represents the data in some way. They must find the mistakes.3. Students then generate a list of rules for proper graphing4. Students use their rules, and data on or
Grades:
7th - 12th
Types:
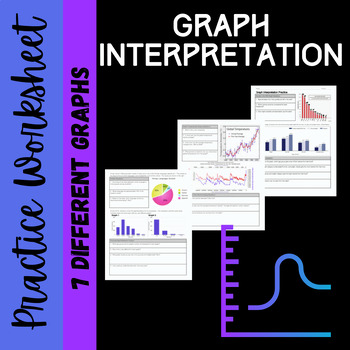
Graph Interpretation Practice
I created this worksheet as a review for students entering my science classes after a long summer of taking selfies. It also helps me assess their incoming knowledge and determine if they need more practice. Students are asked to analyze and interpret data for 7 graphs (line, bar and pie). I have uploaded this in a .docx format so you can modify and differentiate the questions to meet your students' and classroom needs. ANSWER KEY IS INCLUDED. Enjoy!
Subjects:
Grades:
8th - 12th
Types:
Also included in: Science Basic Principles Review Bundle
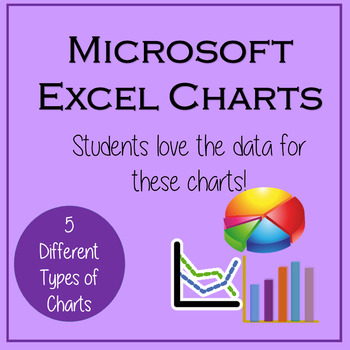
Excel Lessons - Creating Charts
No Prep! These lessons are great as a first Excel Chart lesson or for students already a little familiar with creating charts. Students love the data for these charts because the data is centered around things they love – their cell phones! In Lesson 1, students will create 5 different charts from step-by-step directions which include Chart Titles, Chart Styles, Axis Titles, Data Labels, and Moving Chart to its own Sheet.In Lesson 2, students will create 5 charts from provided data as well as ch
Grades:
5th - 12th
Types:
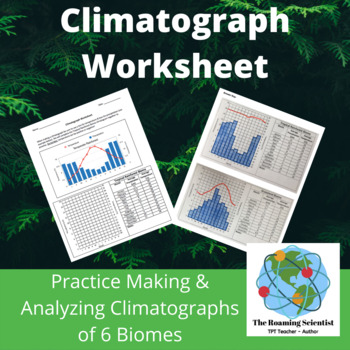
Printable Climatograph Worksheet
This comparative biome graphing worksheet asks students to create and analyze six climatographs for six of Earth’s major terrestrial biomes. Help your students develop graphing skills including drawing bar graphs, line graphs, dual y-axis graphs and interpreting data.This climatograph activity can be used as a lesson, homework assignment, it can be used in small groups or individually or as a revision activity. This is also an excellent substitute teacher lesson. This activity is easily modifiab
Subjects:
Grades:
6th - 12th
Types:
Terminal Speed Physics Lab & Graphing Activity using Coffee Filters {EDITABLE}
Do you want a teach your students about terminal speed, but can't find the time to put together a complex lab and then mark it all?
This is the lab for you!
This is part of my cost-saving, amazing Physics Bundle!
This is a quick lab that your students can complete start to finish in one class period. The student handout pages include:
• Purpose
• Question
• Rationale
• Materials
• Procedure
• Observation Table
• Graphing and Follow-up Questions + Conclusion
You'll need:
• meter stick
• coff
Grades:
7th - 12th
Types:

Excel Spreadsheets Million Dollars Activity
This resource allows students to understand the following: How graphs change when spreadsheet data is alteredUse of SUM() functionsHow graphs are madeComponents of a graphAdvantages of spreadsheets over pen and paper methodsStudents use this resource to understand how altering data in spreadsheets allow graphs to change. They understand such concepts by trying to spend a Million Dollars in a minute. Students are then expected to complete the associated worksheet which accompanies the spreadsheet
Grades:
5th - 12th, Adult Education
Types:
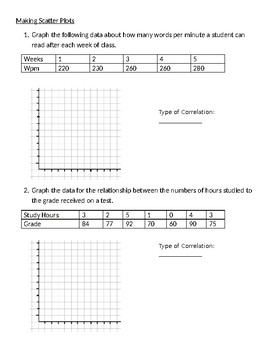
Making Scatter Plots Worksheet
2 pages of practice problems with given information to create scatter plots
Grades:
5th - 12th
Types:
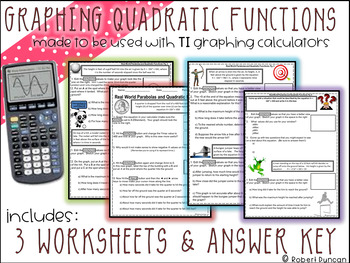
Graphing Quadratic Functions Worksheet for TI Calculators
This is sort of an exploration type activity to help students become more familiar with the window and trace functions of TI calculators. The questions are all application type problems and my goal was to create a worksheet that would let students go at their own pace without me giving direct instruction that was either too fast or too slow for them.
File includes: 4 worksheets to be used with TI Graphing Calculator and detailed answer key.
I found that letting students work with a partner
Subjects:
Grades:
8th - 12th
Types:
Showing 1-24 of 1,538 results


