62 results
Common Core HSS-ID.B.5 resources for Google Apps
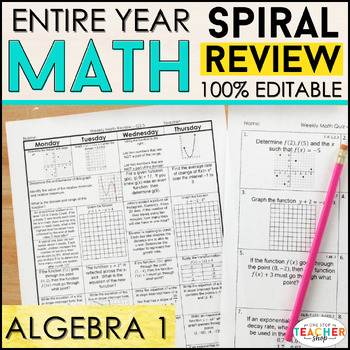
Algebra 1 Spiral Review | Homework, Algebra 1 Warm Ups, Progress Monitoring
This Algebra 1 spiral review & quiz resource can easily be used as HOMEWORK, WARM-UPS, or a DAILY MATH REVIEW! This resource was designed to keep math concepts fresh all year and to help you easily track student progress. All pages are 100% EDITABLE and easy to differentiate to fit your students' needs.⭐⭐UPGRADE for just $10 and get both PRINT & DIGITAL versions } CLICK HERE✪ CLICK HERE to see more SUBJECTS & GRADE LEVELS!★★SAVE $$ with these BUNDLES★★Algebra 1 Bundle: Spiral Review,
Subjects:
Grades:
8th - 10th
Types:
CCSS:
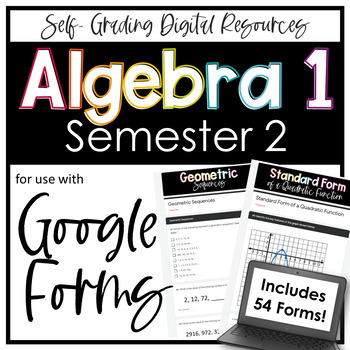
Algebra 1 Google Forms Semester 2 Digital and Printable Homework Bundle
This bundle includes all SEMESTER 2 Algebra 1 editable Google Forms homework assignments, quizzes, and tests that I have created. Every assignment also includes a "worksheet" that corresponds with the questions on each form. Just assign digitally or print + go!Not 1:1? Not using Google Classroom, yet? All of these assignments also come with a stand-alone "worksheet" that may be used with or instead of the digital resource. The SEMESTER 2 BUNDLE includes concepts within the following units:
Subjects:
Grades:
8th - 11th
Types:
CCSS:
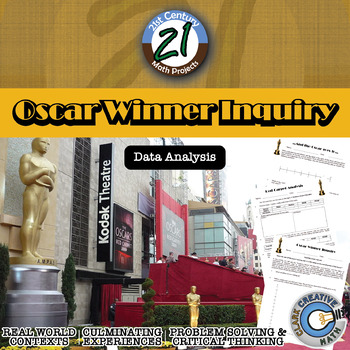
Oscar Winner -- Data Analysis & Statistics Inquiry - 21st Century Math Project
Utilize the last twenty years of Oscar winners as a data set to guide your students through creating box and whisker plots, histograms, and exploring mean, median, and mode -- in one 21st Century Math Project!Does the age of the award winning star in a film relate to the overall gross of the movie? Student will explore this inquiry question and use the data to support their conclusion.In this 8 page document you will be given a mapping to the Content Standards, an outline for how to implement t
Subjects:
Grades:
6th - 12th
Types:
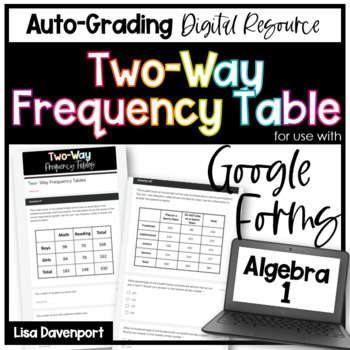
Two Way Frequency Tables Google Forms Homework
This 8-table (16-question), auto-grading Google Forms assignment provides students with practice analyzing and completing two-way tables.Please note:Questions include a variety of types: "multiple-choice", "short response", "drop down", "select all that apply".This download also includes a PDF "worksheet" with the exact same questions as the Google Form. Just assign digitally or print + go!This assignment is also included in my:Algebra 1 Google Forms (Semester 2) BundleYou may be interested in s
Grades:
7th - 9th
Types:
CCSS:
Also included in: Algebra 1 Google Forms Semester 2 Digital and Printable Homework Bundle
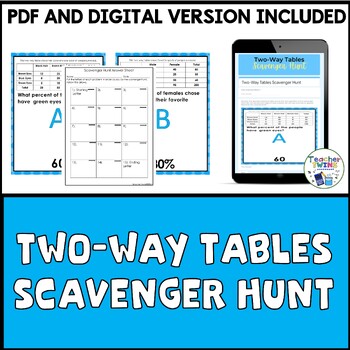
Two-Way Tables Scavenger Hunt
Teaching your students ow to read two-way tables? Need an engaging activity to get students moving while reading two-way tables? Try our Two-Way Tables Scavenger Hunt! This two-way tables scavenger hunt lets students move around while they practice.This scavenger hunt has 3 different two -way tables with 5 questions from each table. This activity has 15 two-way table problems.•12 Find the percent using the two-way table problems.•3 Find how many using the two-way table problems.Included in the
Grades:
7th - 9th
Types:
CCSS:
Data Analysis and Statistics in Algebra 1 Google Forms Homework and Assessment
This Algebra 1 Google Forms bundle currently includes auto-grading assignments on the following skills related to data analysis and statistics:Measures of Central TendencyDot Plots and HistogramsBox PlotsStandard Deviation and The Empirical RuleTwo-Way Frequency TablesScatter PlotsEach assignment also includes a PDF "worksheet" for students to complete along with the form.All of the assignments in this bundle are also included in my:★ Algebra 1 (Semester 2) Google Forms BundleYou may also be int
Subjects:
Grades:
6th - 9th
CCSS:
Data and Statistics Unit | Dot plots, Histograms, Box Plots, and Two-way Tables
A 9-day Data and Statistics CCSS-Aligned complete unit including mean, median, mean average deviation, standard deviation, dot plots, histograms, box plots, and two-way tables.Students will practice with both skill-based problems, real-world application questions, and error analysis to support higher level thinking skills. You can reach your students and teach the standards without all of the prep and stress of creating materials!Standards: CCSS: S.ID.1, S.ID.2, S.ID.3, S.ID.5Learning Focus:repr
Subjects:
Grades:
8th - 9th
Types:
CCSS:
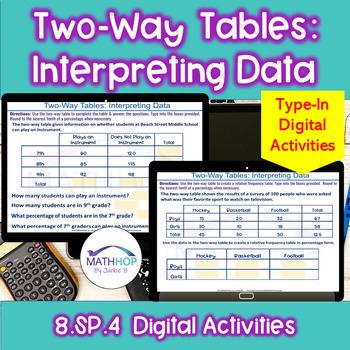
Two-Way Tables & Relative Frequency Tables: Interpreting Data - Digital Activity
Need engaging practice for students to practice interpreting data from two-way tables & relative frequency tables and creating relative frequency tables? This collection of NO PREP Digital problems provide practice on creating & interpreting two-way tables & relative frequency tables in percentage form. Students struggle with data in two-way tables but practice CAN BE engaging. These digital activities that can be used as homework, assessments, supplemental activities.⭐ 12 total slid
Subjects:
Grades:
8th - 9th
Types:
CCSS:

Algebra 1 - ENTIRE YEAR - Exit Tickets for Google Forms™
About This Resource:This is a bundle of all 88 of my Google Forms Exit Tickets that relate to Algebra 1 content and their standards. The instructions for each exit ticket are easy to follow for you to make a copy of the Google Form into your Google Drive. Then you can assign to your students using Google Classroom or some other method.What's Included:Above you can preview each of the exit tickets to see what you will receive. I am continually adding more exit tickets to the collection. You will
Subjects:
Grades:
9th - 11th
Types:
CCSS:
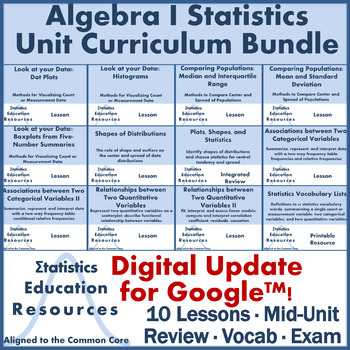
Bundle: Algebra 1 Statistics Unit Curriculum (Common Core)
UPDATE: Now includes lesson slides and editable worksheets for Google™ Slides and unit exam in Google™ Forms!Algebra I Statistics Unit BundleThis product is a bundle that includes 10 Common Core Aligned lessons, 4 statistics vocabulary lists (1 master list for the whole unit, and 3 smaller unit “sub lists”), 1 mid-unit integrated mini-review and worksheet (as homework or a quiz!), and 1 exam with answer key. Each lesson includes lecture slides with speaker notes, a handout, worksheet with answer
Subjects:
Grades:
8th - 11th
Types:
CCSS:
Google Forms™ Quiz - Scatter Plots - 8.SP.1-3 - Distance Learning
About This Resource:This is a Google Forms Quiz on scatter plots. The instructions are easy to follow for you to make a copy of the quiz to your Google Drive. Then you can assign to your students using Google Classroom or some other method.Questions on this assessment were carefully created to give our students the best practice on the following standard.8.SP.1 - Construct and interpret scatter plots for bivariate measurement data to investigate patterns of association between two quantities. De
Subjects:
Grades:
8th - 12th
Types:
CCSS:
High School SBAC Assessment Practice Test - (Google Forms™ and Paper Included)
About This Resource:We all have the pressure of our students performing well on the SBAC. It can be a very intimidating test! I have spent countless hours researching the SBAC summative assessment blueprint and creating items that meet the rigor of the item specifications. Your students will be fully prepared for the test with this resource!What's Included:Claim 1 Practice Test already set up in Google Forms with auto gradingClaim 1 Practice Test in Paper formatClaim 1 Answer Key in PDF formatCl
Subjects:
Grades:
9th - 12th
Types:
CCSS:
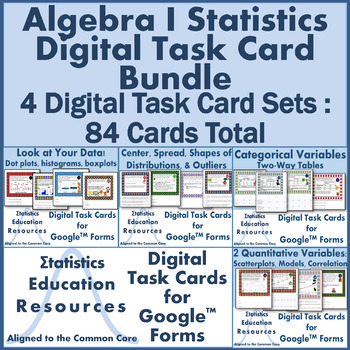
Bundle: Algebra I Statistics Digital Task Cards (84 Cards)
Distance Learning: Algebra I Statistics Digital Task Card Bundle These digital task cards are adapted from the printable version of Algebra I Statistics Task Card Bundle available here. This product is a bundle that includes 4 sets of Common Core-Aligned digital task cards (84 cards total) each created in Google™ Forms. These digital task cards are perfect for distance learning, independent work, graded assessments, or practice. This resource includes answer key with feedback, multiple editable
Subjects:
Grades:
8th - 12th
Types:
CCSS:
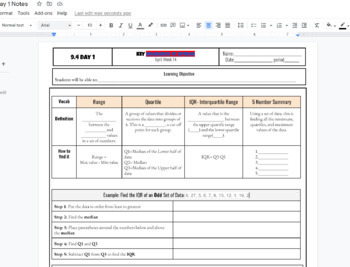
IQR interquartile Range and 5 number summary box and whisker plot Notes
IQR interquartile Range and 5 number summary box and whisker plot Notes including Q1, Q2, Q3, Min and Max and step by step both examples of finding the IQR and creating a box and whisker plot. Used in HS math 1 class WITH KEY INCLUDED AS a link to a printable PDF
Subjects:
Grades:
7th - 12th, Higher Education, Adult Education
CCSS:
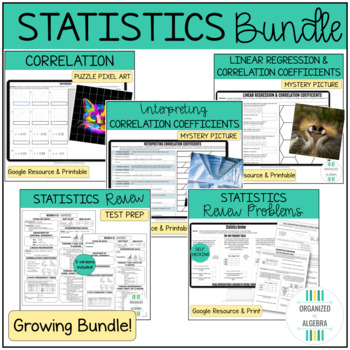
Algebra 1 Statistics Linear Regression Correlation Activities BUNDLE!
Looking for engaging & differentiated activities for your students to practice linear regression, correlation coefficients & statistics?This BUNDLE includes 5 Digital Resources & 1 Paper Resource:Digital:Statistics Digital Review ProblemsCorrelation Puzzle Pixel ActivityInterpreting Correlation Coefficients Mystery PuzzleLinear Regression & Correlation Coefficients Mystery PuzzleStatistics Vocabulary Mystery Picture*All digital activities are self-checking and include many option
Subjects:
Grades:
8th - 11th
Types:
CCSS:
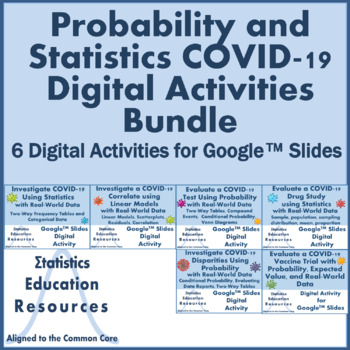
Bundle: Probability and Statistics COVID-19 Digital Activities (Common Core)
Bundle: Probability and Statistics COVID-19 Digital Activities (Common Core) This product is a bundle that includes 6 digital activities that were created in Google™ Slides. Each activity includes a background context relevant to COVID-19, summaries of real-world COVID-19 data derived from international or national health organizations or published research reports, detailed answer key, and instructions for accessing the activities. These activities are very challenging, focused on statistical
Subjects:
Grades:
9th - 12th
Types:
CCSS:
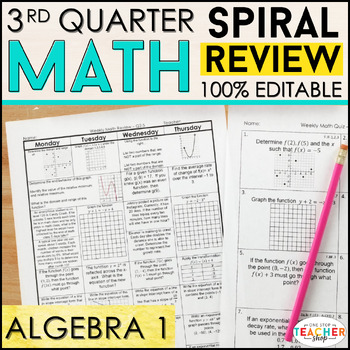
Algebra 1 Review & Quizzes | Homework or Warm Ups | 3rd QUARTER
This Algebra 1 spiral review & quiz resource can easily be used as HOMEWORK, WARM-UPS, or a DAILY MATH REVIEW! This resource was designed to keep math concepts fresh all year and to help you easily track student progress. All pages are 100% EDITABLE and easy to differentiate to fit your students' needs.☝☝ Check out the Preview for more details and 3 FREE Weeks! ☝☝Get the ENTIRE YEAR BUNDLE! {CLICK HERE}★★★★★★★★★★★★★★★★★★★★★★★★★★★★★★★★★★★★★★★★★★★★★★★★★★★★★★★★★★★★★Go 100% Paperless with my GOO
Subjects:
Grades:
8th - 9th
Types:
CCSS:
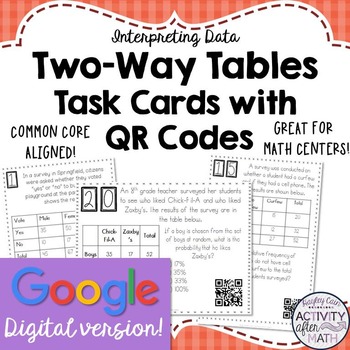
Two-Way Tables (Interpreting Data) Task Cards GOOGLE Slide Distance Learning
GOOGLE SLIDE VERSION Get your students involved with practicing Interpreting Data with Two-Way Tables! Students will have to read two-way tables to calculate relative frequencies. This is a great activity that can be used for distance learning and review in math centers, as individual work, or as a group activity! This integrates the use of technology into the classroom by allowing students to use their phone, tablets, laptops, and desktops to view the task card and by being able to scan the QR
Subjects:
Grades:
8th - 9th
Types:
CCSS:
Also included in: 8th Grade Math DIGITAL TASK CARDS BUNDLE Google Slides
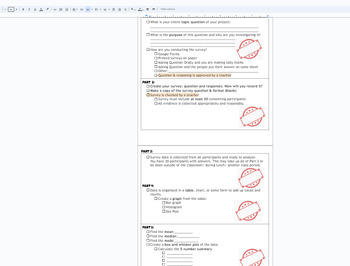
Statistics Survey project Discovery (broken down into sections) with Rubric
This is a broken down (scaffolded) packet of instructions/ guide for a Stats Project for Math 1 HS or 8th grade students. The goal of the project is for students to take a statistical survey on quantitative data (numbers) of their choice. Using this data from the survey, the following will be included in the project:Survey- the question being askedSurvey responses (requirement of 30)Data organization: Bar chart, Histogram, Dot PlotMeanMedianModeBox and Whisket Plot5 number summary (Q1,Q2,Q3, min
Subjects:
Grades:
7th - 12th, Higher Education, Adult Education
CCSS:
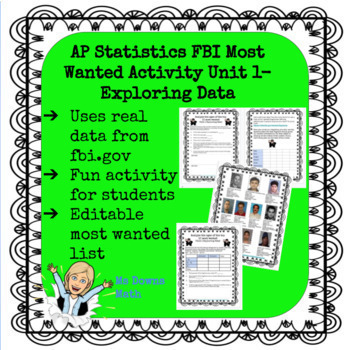
FBI Most Wanted AP Statistics Analyze Categorical and Quantitative Data
I created a series of activities for several units in the AP Statistics curriculum. The students love using data from fbi.gov to review concepts. This activity involves analyzing data related to the top 10 most wanted fugitives. I created this activity in May of 2020 and used the top 10 at that time. In the folder, you will find an editable slide of the top 10 if you want to change it.The answer key for the unit is based on the original top 10 that I used. Teachers have the option of having stud
Subjects:
Grades:
9th - 12th
Types:
CCSS:
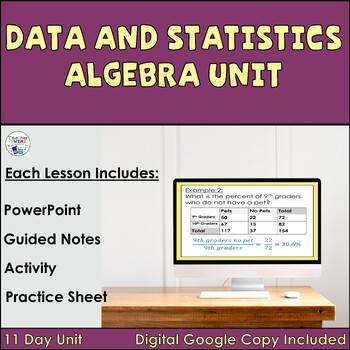
Data and Statistics for Algebra Unit
Make lesson planning easy with this no-prep Data and Statistics for Algebra Unit! Included are 11 ready-made lessons. This unit is very easy to use and will save you a lot of time!Use the Data and Statistics for Algebra Unit to cover Algebra 1/Math 1 data and statistic topics. You will enjoy the ease of using our editable PowerPoints with guided notes. Students will love the Algebra lessons when you use the included activities for each lesson! Great Algebra Lessons to use for Home School!The Dat
Grades:
8th - 9th
CCSS:
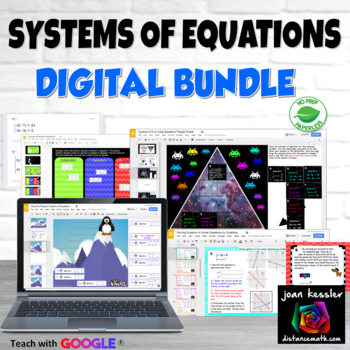
Systems of Equations Digital Activity Bundle plus PRINTABLE Versions
I have bundled 7 Digital resources from the Systems of Linear Equations Unit together to help you and give your students the practice they need while engaging them in a variety of fun yet challenging activities. Though these are NO PREP for you, Almost all of these include PRINTABLE versions. Note: You and your students must have access to the internet and have individual FREE Google Drive Accounts to use the digital versions of the resource. You do not need Google Classroom™ to use these resou
Grades:
8th - 11th
Types:
CCSS:
Categorical Data & Two-Way Tables: Conditional Relative Frequency (Common Core)
UPDATE: Now includes lecture and worksheet with editable features for Google Slides™ !Categorical Data & Two-Way Tables: Conditional Relative Frequency (Common Core Aligned Lesson) This product includes a lesson plan with worksheet and answer key aligned with the common core. Students learn how to compute and interpret conditional relative frequencies from categorical data summarized in two-way frequency tables. Students also learn how to use conditional relative frequencies to recognize pos
Subjects:
Grades:
8th - 12th
Types:
CCSS:
Also included in: Bundle: Algebra 1 Statistics Unit Curriculum (Common Core)
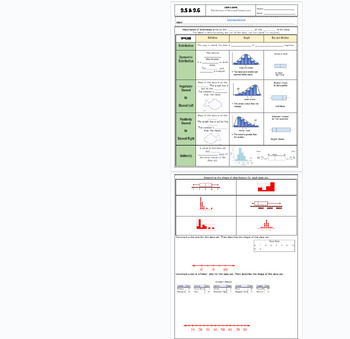
Data Distribution positive/negative skewed fillable notes UPDATED
Unit 9: Data and Stats: Updated(No 9.3/ Skip)9.5/9.6 Data Distribution (skewness)Students go over the vocabulary and complete the examples with the vocabulary scaffolded. Skewness is explained and how to identify it comparing data charts and box and whisker plots. Uses many visuals and examples to differentiate between that different graphs. Notes are scaffolded. Includes hook video hyperlinked on the "learning objective" title. Key is included and hyperlinked as a PDF in the heading highlighted
Subjects:
Grades:
6th - 12th, Higher Education, Adult Education
CCSS:
Also included in: Unit 9: Data and Statistics Fillable Notes
Showing 1-24 of 62 results

