27 results
Common Core HSS-ID.B.5 resources for Microsoft Word
High School Math Common Core Aligned IEP Goal Bank
This IEP goal bank was created to assist special education teachers with the task of writing standards-based IEP goals in math. After spending countless hours developing IEP goals myself and really having to think through how to best individualize goals and objectives for my own students, I wanted to share this resource to help other special education teachers gain back some of their time.This goal bank includes the following:An introduction and guide that explains how to use the document.Each s
Subjects:
Grades:
9th - 12th
CCSS:
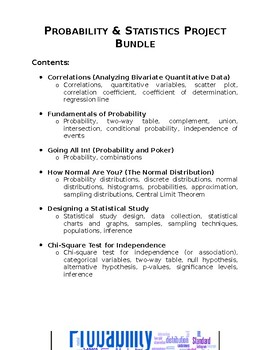
Probability & Statistics Project Bundle
A bundle that contains six different projects for a Probability & Statistics high school course. This bundle includes: Correlations (Analyzing Bivariate Quantitative Data) Fundamentals of Probability Going All In! (Probability, Combinations, and Poker) How Normal Are You? (The Normal Distribution) Designing a Statistical Study Chi-Square Test for Independence These projects are designed to engage students in authentic, hands-on, performance-based tasks. For each of these projects, students c
Subjects:
Grades:
9th - 12th
Types:
CCSS:
High School Math IEP Goal Bank - Statistics and Probability
This IEP goal bank was created to assist special education teachers with the task of writing standards-based IEP goals in math. After spending countless hours developing IEP goals myself and really having to think through how to best individualize goals and objectives for my own students, I wanted to share this resource to help other special education teachers gain back some of their time.This goal bank includes the following:An introduction and guide that explains how to use the document.Each s
Subjects:
Grades:
9th - 12th
CCSS:
AP Statistics Kahoots (10 total): No Prep game/activity for AP Statistics Exam
Get ready to supercharge your AP Statistics exam prep with these 10 Kahoot links! With 10-15 questions in each Kahoot, your students will have daily practice to help them ace the exam at the end of the year. These Kahoots are specifically designed using AP test material, so you can be sure your students are getting the best preparation possible. Perfect for quick spiral review, warm-ups, or closing out class, these Kahoots are the ultimate tool for helping your students succeed. And with the opt
Subjects:
Grades:
10th - 12th
Types:
CCSS:
Math March Madness - A Final Look (Freq Distributions, Stats, Regression Lines)
Fill out a bracket, watch the tournament unfold and then mathematically analyze how you did! This activity is flexible enough to be used for a variety of levels. I have used all 6 pages for an AP Statistics class, and have used pages 1 through 5 for an Algebra or Algebra 2 class. You could even use it in lower levels as long as you are covering percents, and basic stats like mean, median, mode and graphing. The document is editable so you can adjust/delete to tailor to the level of statistic
Subjects:
Grades:
4th - 12th, Higher Education
Types:
AP Statistics Crash Course - Chi-Squared Tests
The product is meant as a review and summary of chi-squared tests (GOF, homogeneity, and independence) to use prior to the AP Exam. This product contains a summary of the process, two worked-out examples, and two unsolved examples for students to practice.
Subjects:
Grades:
10th - 12th
Types:
CCSS:
AP Statistics/Stats FULL Curriculum LINK (notes, wksts, PROJECTS) and Consultant
Get ready to supercharge your students' AP Statistics experience with this dynamic curriculum! With over 50% of students earning 4s or 5s on the AP exam, this program is proven to deliver top results. Featuring color-coded video notes, worksheets, activities, and 10 engaging projects, this curriculum is designed to keep students engaged and excited about statistics. Plus, with a Bowling Field Trip Project Opportunity included, students will have the chance to apply their knowledge in a real-worl
Subjects:
Grades:
10th - 12th
CCSS:
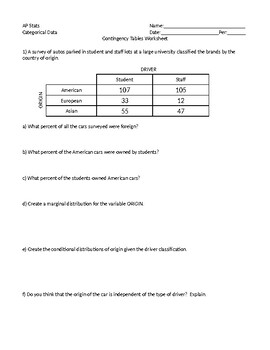
AP Statistics: Contingency (Two-Way) Tables Worksheet
This is a review worksheet on the topic of contingency tables. Students will create conditional and marginal distributions, as well as segmented bar graphs. Associations between variables as well as independence are also covered. AP Statistics Unit 2: Exploring Two-Variable Data.
Subjects:
Grades:
10th - 12th
Types:
CCSS:
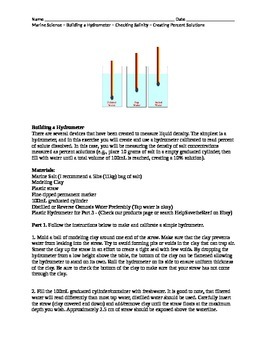
Marine Science Biology Making a Hydrometer Making Percent Solutions
This laboratory experience enables students to create a hydrometer using clay and straws to measure unknown solutions. Students begin by calibrating their devices using percent solutions that they must make. They can then use their device to measure unknown solutions provided by the instructor. Students are asked to convert units of measure. Additional research questions are provided that go beyond the laboratory activity.
Subjects:
Grades:
9th - 12th, Adult Education
Types:
CCSS:
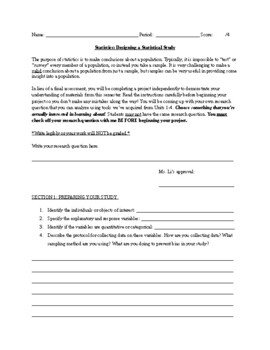
Statistics Project: Designing a Linear Regression Analysis (High School)
Updated as of 5/28 with graphic organizers and sentence starters. Hello!I've designed a statistics project that students in my class loved! This project requires students to collect data on a topic that interests them. They have to design a sampling method that is as unbiased as possible. Students are then required to analyze their data and summary statistics. They also need to do a regression analysis on their study and make inferences using their results. This is perfect for a replacement of
Subjects:
Grades:
9th - 12th, Higher Education
Types:
CCSS:
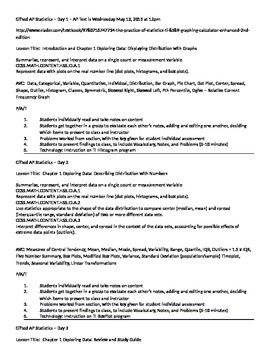
AP Statistics Lesson Plans for 29 Days with CCSS Included
Lesson Plans for High School teachers of AP Statistics. Includes the first half of the course. Common Core State Standards are included for every lesson. Easy to copy and paste into school district lesson plan site. Includes technology, group work, peer evaluation, independent study, and a common sense approach to the day by day student lead teaching of the AP Statistics course. Great template for COMPASS.
Subjects:
Grades:
12th, Higher Education
Types:
CCSS:
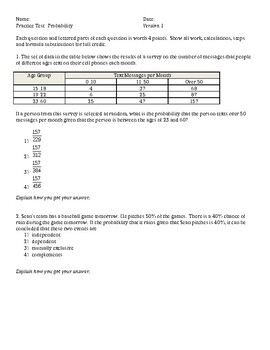
Algebra 2 - Probability Unit Tests- 3 versions
Included are 3 versions of an Algebra 2 unit test on Probability. Topics include:Analyzing Two Way TablesApplying vocabulary: Mutually Exclusive, Independent, ComplementIdentifying and proving IndependenceApplying and using the Addition RuleFinding and solving for conditional probabilityRepresenting data in a two way table and Venn DiagramUsing and recognizing proper probability notation Each version is very similar to the others; the problems have different numbers but the type and level of pro
Subjects:
Grades:
9th - 12th
Types:
CCSS:
Also included in: Algebra 2 - All Assessments - 3 versions of each
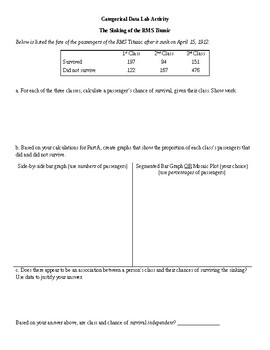
Categorical Data: Titanic Activity
Students apply categorical data analysis techniques to analyze the sinking of the RMS Titanic, and whether class and/or gender played a role in a passenger's chance of survival. I recommend showing a few pictures and/or video clips about the Titanic to engage students before beginning this activity.
Subjects:
Grades:
10th - 12th
Types:
CCSS:
Bivariate Data Analysis Project
First and most importantly this project is easily applicable to different data sets!!!!
I created this project to look at real data that hit home to students. We explored variables that they chose. We decided to analyze the relationship between scholar dollars and GPA (I have included a second relation as well).
Scholar dollars are like merits and demerits. At my school it was a system created as a way for students to track behavior and progress. Student would earn or lose these dollars base
Subjects:
Grades:
7th - 9th
Types:
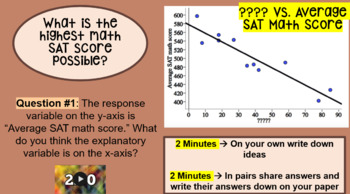
Stats: Inequities in Student Achievement & Poverty (PPT, NOTE SHEET-KEY, CFU)
Empower students to be able to interpret relevant data and make informed decisions based upon that data.Activity Based Learning where students experience first and then formalize their thoughts later.Extremely relevantMath discourse- a lot of room for conversation and critical thinkingProblem solving, reasoning, representation, communication, and connections … Oh my!When and Whereo Pre-Algebra/Algebra 1/Algebra 2: Linear Functions and Equationso Data and Statistics: Analyzing Two-Variable Datao
Subjects:
Grades:
9th - 12th
CCSS:
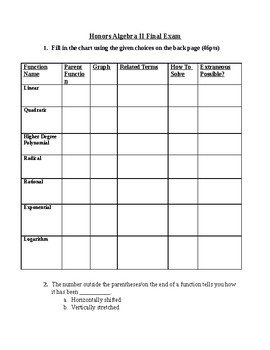
Honors Algebra 2 Final Exam
This is a concept based final exam suitable for average to honors level Algebra 2 curricula. It follows basic common core skill sets and includes probability, number sets, standard distribution, and two-way tables but not trigonometry. I use it as an assessment for the students I home-school and study guide for students in public or private school settings. The first section involves matching graphs, key terms/skills, and parent equations to the various functions introduced in Algebra 2. The voc
Subjects:
Grades:
10th - 12th
CCSS:
Also included in: Algebra 2 Bundle
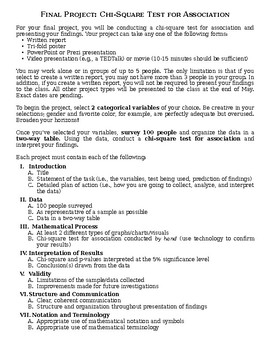
Project: Chi-Square Test for Independence
Project guidelines for a project on the chi-square test for independence (or association). Students select two categorical variables of their choice, collect data from 100 people, organize the data into a two-way table, and conduct a chi-square test for independence. They then interpret the results in relation to p-values and significance levels, and they discuss the validity of their findings. Makes for a great final project that the students will enjoy.(Note: This project is modeled off of the
Subjects:
Grades:
9th - 12th
Types:
CCSS:
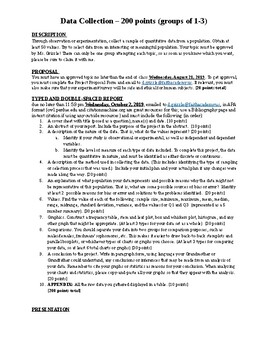
Bluman Statistics Chapters 1-3 Cumulative Project
This is a Microsoft Word document, so it can be edited to fit your own classroom needs. It is a project I used in my 12th grade Statistics class. I gave it out the second week of the quarter and set aside one day a week to work with my students on this project through all of first quarter. This project is aligned with chapters 1-3 of Elementary Statistics: A Step by Step Approach 8th edition, but can be adapted to fit any Statistics textbook. Specifically, this project includes descriptive and i
Subjects:
Grades:
11th - 12th, Higher Education
Types:
CCSS:
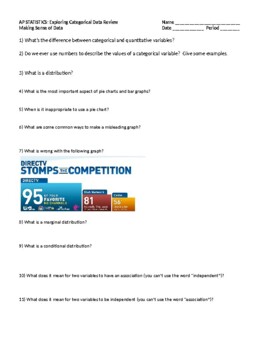
AP Statistics: Categorical (Qualitative) Data Review
This worksheet provides review problems for all topics regarding categorical data. Types of graphs, vocabulary, bias, and contingency (2-way) tables are all reviewed. This is a fully editable word document with an answer key provided.
Subjects:
Grades:
10th - 12th
Types:
CCSS:
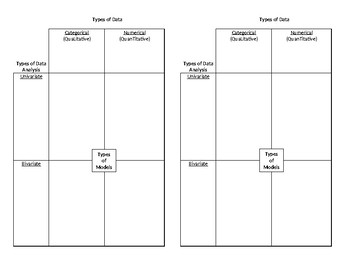
Intro to Data Analysis Graphic Organizer
I created this template for an introduction to my data analysis unit in Algebra I. We discuss and define categorical vs. numerical data, univariate vs. bivariate analysis, and the different graphs or models that apply to each. Since we use Interactive Notebooks, it is designed to be half a page.
Subjects:
Grades:
7th - 12th
CCSS:
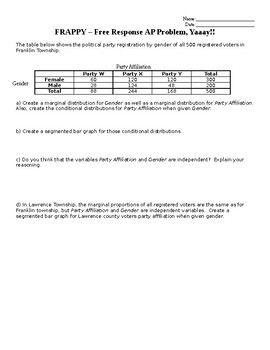
AP Statistics: Contingency Table Free Response Question
This is an AP-level free-response question regarding contingency tables. It is in word format and is completely editable as needed. Answer Key is included in the document.
Subjects:
Grades:
10th - 12th
Types:
CCSS:
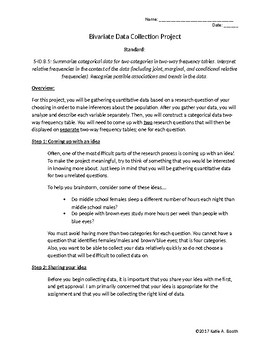
Bivariate Categorical Data Project
This is an Algebra 1 Statistics project I have completed with my students. The final project contained a hand drawn two-way frequency table with the write up and other documents attached to poster paper.
Subjects:
Grades:
8th - 12th
CCSS:
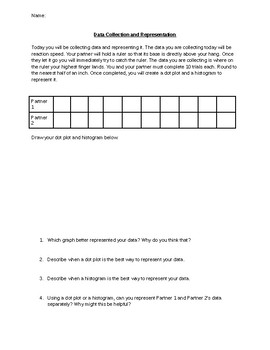
Ruler Response Time Statistics Activity
Students collect, represent, and analyze data over response time. This a fun activity where students work with a partner to collect data and then represent it as a histogram and dot plot. It is also a nice lead in to box plots and being able to represent different data on the same graph.
Subjects:
Grades:
6th - 12th
Types:
CCSS:
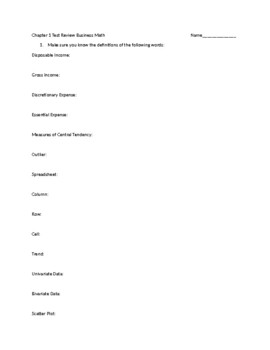
Financial Algebra Chapter 1 Study Guide
This is a study guide based on lessons 1-1, 1-2, and 1-5 of the text book Financial Algebra by Gerver and Sgroi. The topics covered are discretionary expenses with statistics applications.
Grades:
9th - 12th
Types:
CCSS:
Showing 1-24 of 27 results

