81 results
Common Core HSS-ID.A.4 resources for Google Apps
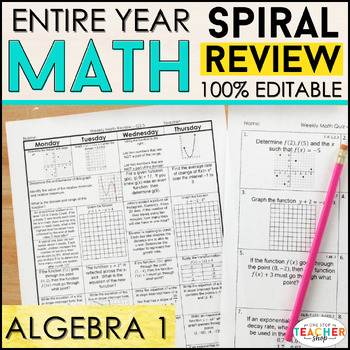
Algebra 1 Spiral Review | Homework, Algebra 1 Warm Ups, Progress Monitoring
This Algebra 1 spiral review & quiz resource can easily be used as HOMEWORK, WARM-UPS, or a DAILY MATH REVIEW! This resource was designed to keep math concepts fresh all year and to help you easily track student progress. All pages are 100% EDITABLE and easy to differentiate to fit your students' needs.⭐⭐UPGRADE for just $10 and get both PRINT & DIGITAL versions } CLICK HERE✪ CLICK HERE to see more SUBJECTS & GRADE LEVELS!★★SAVE $$ with these BUNDLES★★Algebra 1 Bundle: Spiral Review,
Subjects:
Grades:
8th - 10th
Types:
CCSS:

Algebra 1 Google Forms Semester 2 Digital and Printable Homework Bundle
This bundle includes all SEMESTER 2 Algebra 1 editable Google Forms homework assignments, quizzes, and tests that I have created. Every assignment also includes a "worksheet" that corresponds with the questions on each form. Just assign digitally or print + go!Not 1:1? Not using Google Classroom, yet? All of these assignments also come with a stand-alone "worksheet" that may be used with or instead of the digital resource. The SEMESTER 2 BUNDLE includes concepts within the following units:
Subjects:
Grades:
8th - 11th
Types:
CCSS:
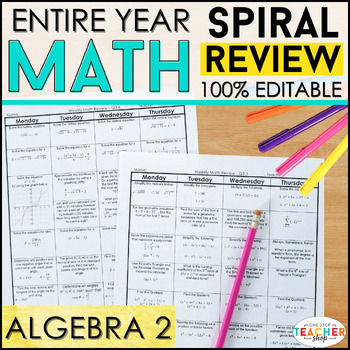
Algebra 2 Spiral Review | Homework, Algebra 2 Warm Ups, Progress Monitoring
This ALGEBRA 2 spiral review & quiz resource can easily be used as HOMEWORK, WARM-UPS, or a DAILY MATH REVIEW! This resource was designed to keep math concepts fresh all year and to help you easily track student progress. All pages are 100% EDITABLE and easy to differentiate to fit your students' needs.⭐⭐UPGRADE for just $10 and get both PRINT & DIGITAL versions } CLICK HERE✪ CLICK HERE to see more SUBJECTS & GRADE LEVELS!Create Your Own BUNDLE: YOU pick what's included and SAVE!!Wha
Subjects:
Grades:
10th - 12th
Types:
CCSS:
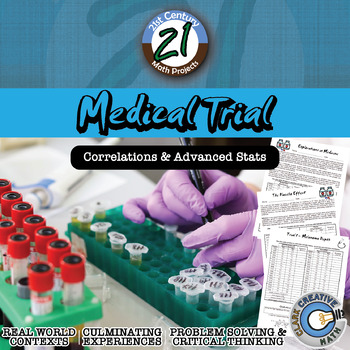
Medical Trial -- Statistics & T-Test - 21st Century Math Project
Bring your students into the world of double blind medical studies. Every day, doctors and hospitals rely on scientific studies and research to make healthcare decisions for patients. Are some medicines more effective than others? Do certain types of patients benefit more from certain types of treatments? Due to the security of medical records, studies are somewhat limited in their scope and are generally carried out at universities and research hospitals. At these facilities ground breaking wo
Subjects:
Grades:
8th - 12th
Types:
CCSS:
Data Analysis and Statistics in Algebra 1 Google Forms Homework and Assessment
This Algebra 1 Google Forms bundle currently includes auto-grading assignments on the following skills related to data analysis and statistics:Measures of Central TendencyDot Plots and HistogramsBox PlotsStandard Deviation and The Empirical RuleTwo-Way Frequency TablesScatter PlotsEach assignment also includes a PDF "worksheet" for students to complete along with the form.All of the assignments in this bundle are also included in my:★ Algebra 1 (Semester 2) Google Forms BundleYou may also be int
Subjects:
Grades:
6th - 9th
CCSS:
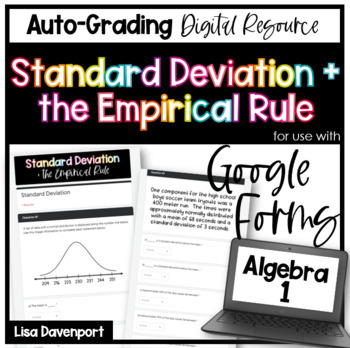
Standard Deviation and the Empirical Rule Google Forms Homework
This 18-question, auto-grading Google Forms assignment provides students with practice applying the concepts of mean, standard deviation, and the empirical rule. Students will be asked to approximate/ calculate percentages of data values, given the mean and the standard deviation.All questions are "drop-down".This assignment is also included in my Algebra 1 (Semester 2) Bundle for Google FormsThis download also includes a PDF "worksheet" with the exact same questions as the Google Form. Just as
Subjects:
Grades:
9th - 12th
Types:
CCSS:
Also included in: Algebra 1 Google Forms Semester 2 Digital and Printable Homework Bundle
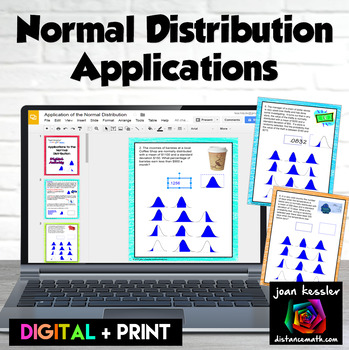
Normal Distribution Applications Digital Activity plus Print
In this digital interactive activity for Applications of the Normal Distribution your students will solve 10 real world applications of the Normal Distribution with GOOGLE® Slides. They will first analyze the problem, then “sketch” the scenario by selecting one of 12 shaded normal distribution diagrams, and then determine the solution either using technology or manually by tables using z-scores.A printable version of the questions is also included. Students will also read, analyze and sketch
Subjects:
Grades:
9th - 12th
Types:
CCSS:
Also included in: Probability and Statistics Algebra 2 Unit 11 Activity Bundle
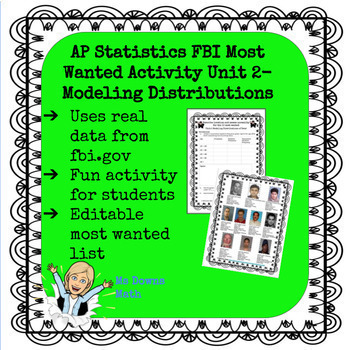
FBI Most Wanted AP Statistics, Modeling Data, Z scores and Normal Distributions
I created a series of activities for several units in the AP Statistics curriculum. The students love using data from fbi.gov to review concepts. This activity involves analyzing data related to the top 10 most wanted fugitives. I created this activity in May of 2020 and used the top 10 at that time. In the folder, you will find an editable slide of the top 10 if you want to change it.The answer key for the unit is based on the original top 10 that I used. Teachers have the option of having stud
Subjects:
Grades:
9th - 12th
Types:
CCSS:

Standard Deviation Whodunnit Activity - Printable & Digital Game Options
Nothing like a good criminal investigation to liven up standard deviation! Based off my popular CSI projects, I have created Whodunnits? The Whodunnits plan to focus on single content topics as opposed to units and will focus more on skill building than application. Every day can't be a project day, so Whodunnits can be an engaging out of their seat activity to practice important skills. In a Whodunnit?, students will work in teams to solve 10 practice problems that increase in difficult. After
Subjects:
Grades:
7th - 12th
Types:
CCSS:
Also included in: Measures of Center & Variance Unit Bundle - Distance Learning Compatible
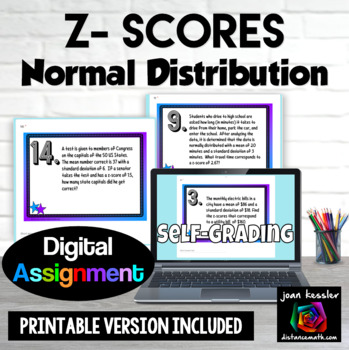
Normal Distribution Z-Scores Digital plus Print
Your students will get extra practice and gain fluency learning about z-scores and the Normal Distribution with both a self-grading digital resource and a PDF printable version. There are 16 applications to solve with a mix of multiple choice and free response including: finding the z-scorefinding the standard deviation knowing the z-score, mean, and data point finding the mean knowing the z-score, data point, and standard deviationinterpreting the z-score. Your download includes:PDF with link
Subjects:
Grades:
9th - 12th
Types:
CCSS:
Also included in: Probability and Statistics Algebra 2 Unit 11 Activity Bundle

Stock Market Game - Stock Market Simulation Game for Middle and High School
THE STOCK MARKET GAME! Create a virtual Stock Exchange in your own classroom and allow students to experience the basics of investing!In The Stock Market Game, students are introduced to the foundations of investing and how the stock market actually works. Open their eyes to new possibilities and teach them a tool they can use to improve their financial future! (While implementing essential math standards, of course!)The Stock Market Game includes everything you need set the stage and experience
Subjects:
Grades:
6th - 12th
CCSS:
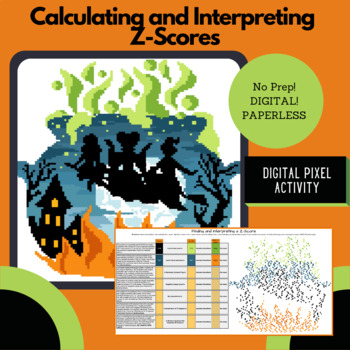
HALLOWEEN - Calculating and Interpreting Z-Scores - Stats Digital Pixel Reveal
~~ Watch the Video Preview to See All Questions included ~~In this activity, students will practice finding the z-score for various problems and interpreting the value as the number of standard deviations above or below the mean. I am using pixel activities in AP Statistics as warm ups and exit tickets to review quick math facts or calculator functions! I have also assigned longer ones for homework. As students type in the correct answer, a piece of the picture will appear, providing them with i
Subjects:
Grades:
9th - 12th
Types:
CCSS:
Also included in: AP Stats Digital Activities for all chapters!
Measures of Center & Variance Unit Bundle - Distance Learning Compatible
This is a selection of my Measures of Center & Variance resources all in a money saving Essential Bundle! You save significant money and time versus purchasing these separately!Essential Bundles are designed to give you everything you need to rock your unit. Warmups, Notes, Activities, Games, Exit Tickets, and Tests. You will find a selection of my Drive Instruction, Escapes, Boot Camp, Adventures, Whodunnits, CSI, Person Puzzles, STEM-ersions, Herowork, TableTop and my 21st Century Math Pro
Subjects:
Grades:
6th - 12th
Types:
High School SBAC Assessment Practice Test - (Google Forms™ and Paper Included)
About This Resource:We all have the pressure of our students performing well on the SBAC. It can be a very intimidating test! I have spent countless hours researching the SBAC summative assessment blueprint and creating items that meet the rigor of the item specifications. Your students will be fully prepared for the test with this resource!What's Included:Claim 1 Practice Test already set up in Google Forms with auto gradingClaim 1 Practice Test in Paper formatClaim 1 Answer Key in PDF formatCl
Subjects:
Grades:
9th - 12th
Types:
CCSS:

Normal Distribution in a real life context: Lake Tekapo Fish Mongers
Are you having trouble explaining what Normal distribution is and how it can be used in real life? Are your students craving a hands on activity that would make sense of this concept? Do you need an engaging project on statistics? Would you like an activity that already has enrichment, scaffolding and all of the material ready to go? If you answered yes to any or all of these questions, this project is tailor made for you!Your students will assume a role of a research team for a fishing company.
Subjects:
Grades:
10th - 12th, Higher Education
Types:
CCSS:
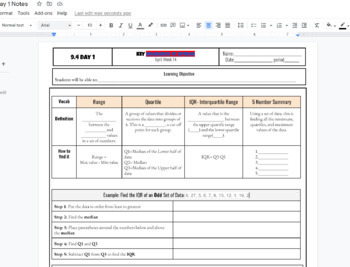
IQR interquartile Range and 5 number summary box and whisker plot Notes
IQR interquartile Range and 5 number summary box and whisker plot Notes including Q1, Q2, Q3, Min and Max and step by step both examples of finding the IQR and creating a box and whisker plot. Used in HS math 1 class WITH KEY INCLUDED AS a link to a printable PDF
Subjects:
Grades:
7th - 12th, Higher Education, Adult Education
CCSS:
Standard Deviation Printable & Digital Activity - Baseball Mathlete
***THIS PRODUCT HAS BEEN UPDATED WITH A GOOGLE SLIDES INTERACTIVE VERSION INCLUDED. REDOWNLOAD IF YOU HAVE IT ALREADY***Mathlete Sports Tasks are hypothetical situations geared to a sports fan that require them to step inside the white lines! Millions of students and teachers enjoy sports and these tasks leverage the vast math applications and layer them critical thinking skills. Students must analyze data, perform calculations, construct multiple arguments with the data, AND make a decision. Al
Subjects:
Grades:
7th - 12th
Types:
CCSS:
Also included in: Measures of Center & Variance Unit Bundle - Distance Learning Compatible
Mean, Median, Mode & Range Printable & Digital Activity - Hockey Mathlete
***THIS PRODUCT HAS BEEN UPDATED WITH A GOOGLE SLIDES INTERACTIVE VERSION INCLUDED. REDOWNLOAD IF YOU HAVE IT ALREADY***Mathlete Sports Tasks are hypothetical situations geared to a sports fan that require them to step inside the white lines! Millions of students and teachers enjoy sports and these tasks leverage the vast math applications and layer them critical thinking skills. Students must analyze data, perform calculations, construct multiple arguments with the data, AND make a decision. Al
Subjects:
Grades:
5th - 12th
Types:
CCSS:
Also included in: Measures of Center & Variance Unit Bundle - Distance Learning Compatible
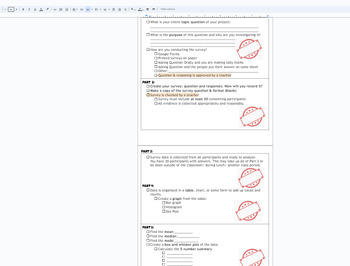
Statistics Survey project Discovery (broken down into sections) with Rubric
This is a broken down (scaffolded) packet of instructions/ guide for a Stats Project for Math 1 HS or 8th grade students. The goal of the project is for students to take a statistical survey on quantitative data (numbers) of their choice. Using this data from the survey, the following will be included in the project:Survey- the question being askedSurvey responses (requirement of 30)Data organization: Bar chart, Histogram, Dot PlotMeanMedianModeBox and Whisket Plot5 number summary (Q1,Q2,Q3, min
Subjects:
Grades:
7th - 12th, Higher Education, Adult Education
CCSS:
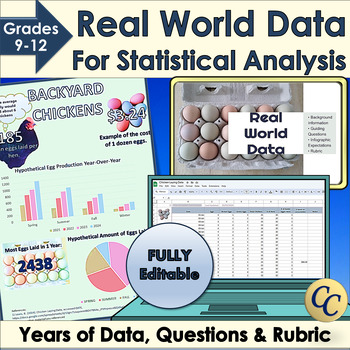
Real World Data for Statistical Analysis and Infographic Project
Give your students access to real world data for your statistical analysis unit or data literacy! Dive into statistics with Microsoft Excel™ or Google Sheets™ and years of data. Learn how to use standard deviation, mean or median to interpret data. Choose the best graphs to display conclusions in an infographic. Works great for science fairs! ✔ Includes an infographic project! (Template, expectations, and rubric). ✔ Everything is fully editable and you and your students can even use the images
Grades:
9th - 12th
Types:
CCSS:
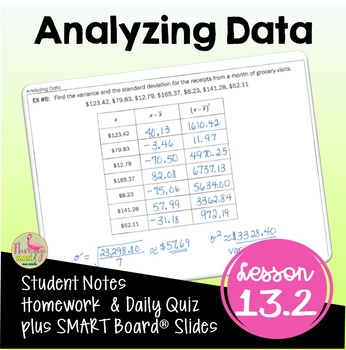
Analyzing Data (Algebra 2 - Unit 13)
Analyzing Data Algebra 2 Lesson:Your Pre-AP Algebra 2 Honors students will find range, interquartile range, standard deviation, variance, and z-scores in this unit 13 lesson on Data Analysis & Statistics that cover the concepts in depth. #distancelearningtptWhat is included in this resource?⭐ Guided Student Notes⭐ Google Slides®⭐ Fully-editable SMART Board® Slides⭐ Homework/Practice assignment⭐ Lesson Warm-Up (or exit ticket)⭐Daily Content Quiz (homework check)⭐ Video Lesson Link for Distanc
Subjects:
Grades:
8th - 11th, Higher Education
Types:
CCSS:
Also included in: Algebra 2 Curriculum Mega Bundle | Flamingo Math
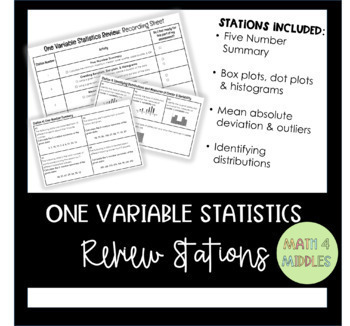
One Variable Statistics: Stations Review
Stations are a great way for students to practice skills or review for an upcoming assessment! Use this resource for your Algebra 1 students to review everything about one variable statistics.Station Topics Included:Five-Number SummaryCreating Boxplots, Dot plots, & HistogramsMean Absolute Deviation & OutliersIdentifying DistributionsTerms of Use:This product should only be used by the teacher who purchased it. This product is not to be shared with other teachers. Please buy the correct
Subjects:
Grades:
9th
Types:
CCSS:
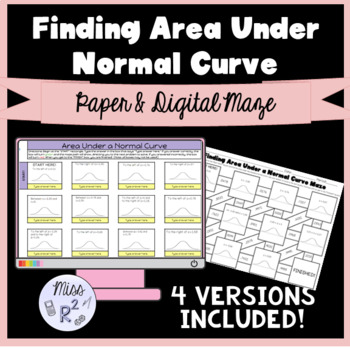
Finding Area Under Normal Curve Mazes - DIGITAL AND PAPER VERSION!
In this activity, students will practice finding the area under a normal curve. There are four different versions available. The first two versions are a paper and digital version of finding areas to the left, right, between, and outside of different z-scores. The last two versions include the sample problems with inequality symbols (ex: z < 0.15, z > 0.7, etc.)Paper versions include a total of 11 problems (9 of which students will solve while completing the maze.) Digital versions are
Subjects:
Grades:
10th - 12th
Types:
CCSS:

Z-Scores using Google Forms™ | 2 Assessments or Homework
✯Two Self-Grading Algebra 2 Assessments or homework assignments using Google Forms™ - 48 total multiple choice and checkbox questions. 24 questions on each form. Topics covered: Finding and interpreting z-scores Finding data points when given the mean, z-score, and standard deviation Finding probabilities/percentiles using z-tables (or the invNorm command) Finding data points/ranges using z-tables (or the normalcdf command) See sample questions above! The preview shows various types of questi
Subjects:
Grades:
9th - 12th
Types:
CCSS:
Also included in: Algebra 2 Google Forms™
Showing 1-24 of 81 results

