5 results
Common Core HSS-ID.A.4 interactive whiteboards
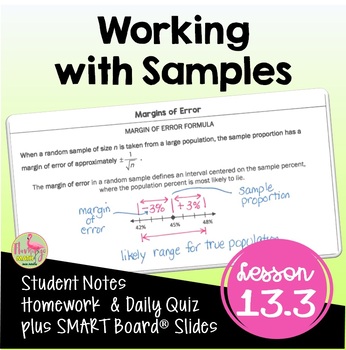
Working with Samples (Algebra 2 - Unit 13)
Working with Samples Algebra 2 Lesson:Your Pre-AP Algebra 2 Honors students will find draw, analyze and interpret box-and-whisker plots, find outliers, and calculate measures of central tendency in this unit 13 lesson on Data Analysis & Statistics that cover the concepts in depth. #distancelearningtptWhat is included in this resource?⭐ Guided Student Notes⭐ Google Slides®⭐ Fully-editable SMART Board® Slides⭐ Homework/Practice assignment⭐ Lesson Warm-Up (or exit ticket)⭐Daily Content Quiz (ho
Subjects:
Grades:
8th - 11th, Higher Education
CCSS:
Also included in: Algebra 2 Curriculum Mega Bundle | Flamingo Math
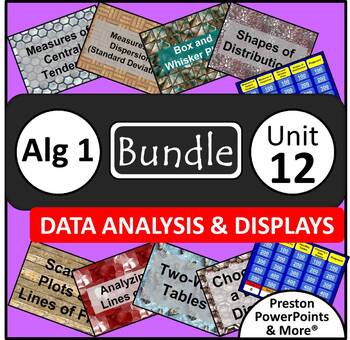
(Alg 1) Data Analysis and Displays {Bundle} in a PowerPoint Presentation
Algebra 1 Data Analysis and Displays {Bundle} in a PowerPoint PresentationThis is a bundle include the eight PowerPoint lessons below and two Quiz Show games, Jeopardy Style, for review.Measures of Central Tendency S.ID.2, S.ID.3Measures of Dispersion (Standard Deviation) S.ID.2, S.ID.3Box-and-Whisker Plots S.ID.1, S.ID.2, S.ID.3Shapes of Distributions S.ID.2, S.ID.3Quiz Show Game Central Tendencies and Dispersion S.ID.1, S.ID.2, S.ID.3Scatter Plots and Lines of Fit 8.SP.1, S.ID.6a, S.ID.6c, S
Grades:
8th - 10th
CCSS:
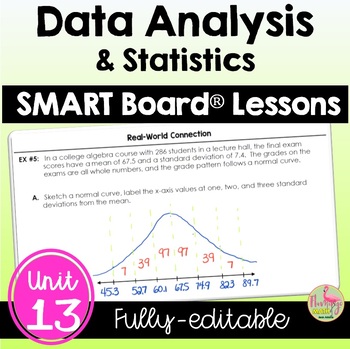
Data Analysis and Statistics SMART Board® Lessons (Algebra 2 - Unit 13)
Data Analysis & Statistics SMART Board Bundle:This bundle of SMART Board® presentations for Algebra 2 Honors students covers Unit 13: DATA ANALYSIS & STATISTICS. You have total freedom to alter and revise each fully-editable SMART Notebook® file. Then, you can teach and present your lesson with any compatible Interactive Whiteboard. There are 108 slides to cover the concepts in depth.The unit includes the following topics:1) Measures of Central Tendency2) Analyzing Data3) Working With S
Subjects:
Grades:
8th - 11th, Higher Education
CCSS:
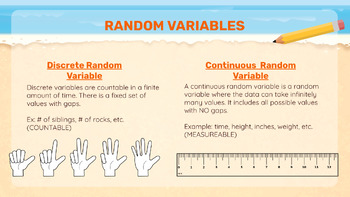
Normal Distributions and Random Variables: Guided Lesson: High School Statistics
This is a guided lesson on normal distributions and random variables. The lesson walks students through examples on how to identify discrete and continuous variables. It also goes over normal distributions, the empirical rule, and how to find z-scores. This lesson includes examples that you can use to walk students through the problems. If you teach with a tablet, iPad, or a Smart board, this lesson is adaptable to these technologies. Students love the interactive lesson! If you teach with Stats
Subjects:
Grades:
10th - 12th
CCSS:
Also included in: Normal Distributions and Random Variables Bundle: High School Statistics
SID.4 Calculating the Area Under the Normal Curve.
This lesson teaches students how to use the mean and standard deviation of a data set to create a normal curve and how to calulate the area (population percentage) under the normal curve given a range of values.
This lesson includes a SMART Notebook Presentation, guided notes with class work problems, and an answer key. The guided notes correspond with the SMART Notebook Presentation.
Subjects:
Grades:
9th - 12th
CCSS:
Showing 1-5 of 5 results

