206 results
2nd grade graphing resources for Easel Activities
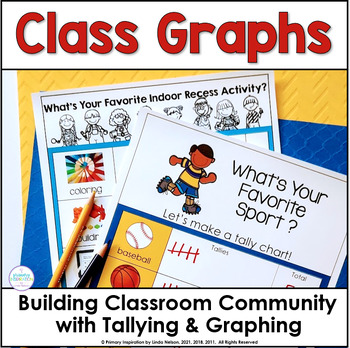
Bar Graphs & Tally Marks - Graphing Math Data to Build Classroom Community
This fun set of graphing activities gives your students lots of relevant practice collecting and interpreting data with ready-to-use bar graphs and tally mark charts. Plus, it builds classroom community and develops meaningful connections! Here's what this graphing and tallying resource includes!➯ 23 one page horizontal and vertical bar graphs designed to build classroom community as your students learn about how they are alike and different. Topics range from favorite foods, sports, and books,
Subjects:
Grades:
K - 3rd
Types:
CCSS:
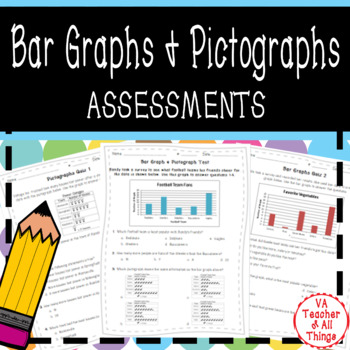
Reading Bar Graphs and Pictographs Assessments SOL 3.15
Test your students' ability to read and create bar graphs and pictographs of varying scales using these 4 quizzes and 1 test. Aligns with Virginia math SOL standard 3.15. Product Includes: Two 6 question quizzes on reading bar graphs (each with one "bonus" 7th question)Two 6 question quizzes on reading pictographs (each with one "bonus" 7th question)One 20 question test on reading and creating bar graphs and pictographs combined (The test is easily printable as two 10-question quizzes or tests i
Subjects:
Grades:
2nd - 4th
Types:
Also included in: Bar Graphs & Pictographs Bundle SOL 3.15
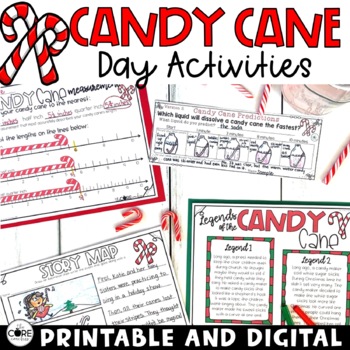
Candy Cane Day Activities - Candy Cane Science - December Themed Lesson Plans
Candy Cane themed activities to engage your students in meaningful learning mixed with fun! These Candy Cane activities are offered in both print and digital so teachers can mix it up to find the perfect balance of versatility that meets the face-to-face and device-based learning needs of a modern classroom.This resource is preloaded to Google Slides and SeeSaw. One click links are provided for the activities on both platforms making it easy to assign to students digitally. Please view the vid
Grades:
1st - 3rd
Types:
Also included in: 12 Days of Christmas Countdown - Christmas Activities Print and Digital
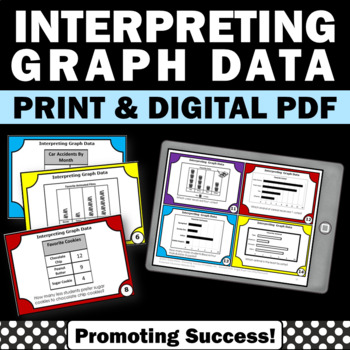
Bar Graph Practice Reading Charts and Graphs Analyzing Data 2nd 3rd Grade Math
Data and Measurement: You will download 30 bar graph task cards for your 2nd, 3rd or 4th grade students to practice reading, analyzing, and interpreting charts and graphs data. They are a great supplement for your 2nd or 3rd grade measurement and data math standards.For your convenience, you will download both TPT digital EASEL and printable PDF resource formats. ☛ Please click on the PREVIEW above.You may use the printable bar graph practice task cards in your math stations or centers for fun p
Subjects:
Grades:
2nd - 3rd
Types:
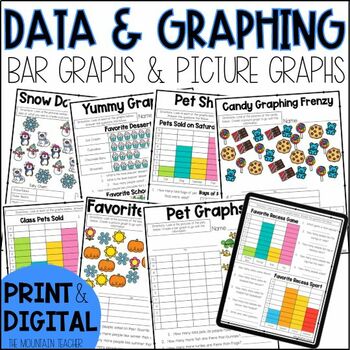
Bar Graphs and Picture Graphs Graphing Worksheets for 2nd Grade
Teach bar graphs and picture graphs to your 2nd or 3rd graders with ease using these graphing worksheets and assessments. This 3 week unit is filled with printable and digital graphing worksheets, assessments and activities covering various types of word problems about different graphs.Students will practice collecting data, graphing data on bar graphs and picture graphs and answering questions about the data using the graphs. Students will practice using graph keys on both picture graphs and ba
Subjects:
Grades:
1st - 3rd
Types:
CCSS:
Also included in: 2nd Grade Math Worksheets and Lessons YEAR BUNDLE Print and Digital
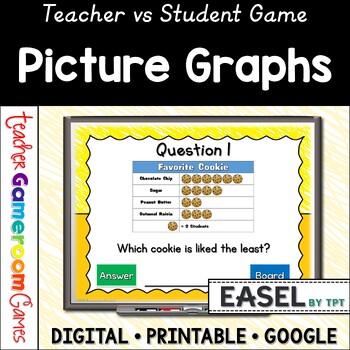
Pictographs Powerpoint Game | Picture Graphs | Digital Resources | Graphs & Data
Pictographs game! Students will answer questions about two picture graphs. Questions include most/least favorites, totals for each group, and comparing groups. There are 2 graphs in this game, each with 10 questions, giving you a total of 20 questions. The question disappears after you've clicked on it, so you know you've answered it. The scoreboard allows you to add scores during Slideshow Mode. Great digital resource for a quick math morning review or center activity. Great for individual prac
Subjects:
Grades:
K - 3rd
Also included in: Graphs Bundle | No Prep Digital Resources
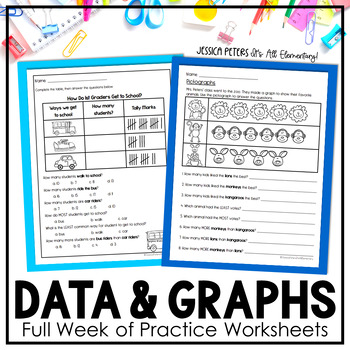
Data and Graphing Worksheets | Bar Graphs, Pictographs, Tally Charts | 1st Grade
Full week of Graphing and Data Worksheets for practice, homework, and assessment. Bar graphs, pictographs, tally marks, and table included. Appropriate for Kindergarten, 1st grade, and 2nd grade. If you are teaching graphing lessons next week, this should get you out the door more quickly! This packet includes a full week of practice worksheets, HW worksheets, and a test on graphing and data. Please note: I recently update this file to remove the large black heading at the top right of each page
Subjects:
Grades:
K - 2nd
Types:
CCSS:
Second Grade Social Studies-Common Core Economics Unit
This is an economics unit for second grade that is aligned with Second Grade Common Core Social Studies Standard E.1.1-1.6. This unit includes almost everything you need to teach this standard. There are lesson plans for you, a student book, a study guide, a test, a take home project with a parent letter, a wallet and money and a classroom game. This is a 10 day unit.
Subjects:
Grades:
2nd - 3rd
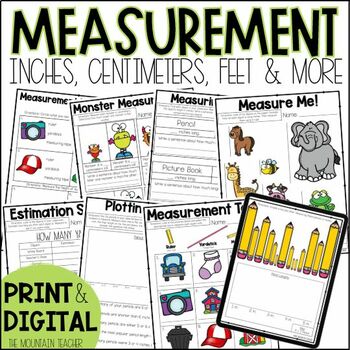
Measurement Worksheets, Anchor Charts & Assessments for 2nd Grade
Need some helpful measurement worksheets and anchor charts for your 2nd grade students? This 2 week unit is filled with printable and digital measurement worksheets, assessments and hands-on activities covering using a ruler, inches, centimeters, comparing lengths, length, width, height, estimating, line plots, selecting the correct tool, and more.What's Included in the Measurement Worksheets:23 Page Digital Workbook (9 Printable Worksheets PDF)Digital/Printable Pre and Post TestTeaching GuideAn
Subjects:
Grades:
1st - 3rd
Types:
Also included in: 2nd Grade Math Worksheets and Lessons YEAR BUNDLE Print and Digital
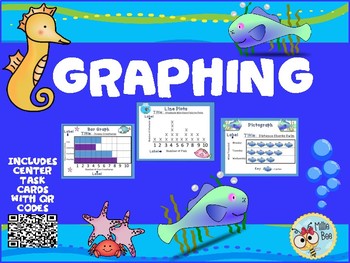
GRAPHS- Bar Graphs - Pictographs - Line Graphs -2nd grade -Print and Digital
Lots of graphing practice with this ocean themed unit. This hands on unit includes bar graphs, pictographs, and line plots for lots of student graphing practice. Students will interpret graphs and create their own. Included are 4 posters, two practice worksheets for each type of graph, and a separate section for center activities with QR codes. The center activities include 4 separate graphs with 16 task cards with QR codes. Answer key is included. A QR reader is not necessary since an answer
Grades:
2nd
Types:
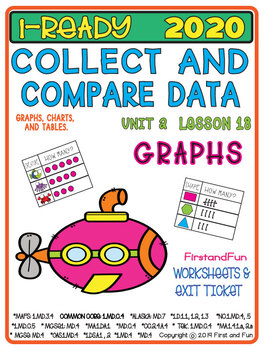
COLLECT AND COMPARE DATA GRAPHS TALLY MARKS OBJECTS READY MAF 1st Grade Math
TALLY GRAPHS AND PICTURE GRAPHSProduct DescriptionThis math pack is a great addition to any Math Curriculum for first grade. This product has extensive practice for students who are learning to understand how sort and compare object (with addition and subtraction equations) how to read complete tally and picture graphs. There are opportunities to compare data utilizing word problems.This pack is a great addition to any Math Curriculum for kinder and first grade. There are 29 differentiated works
Subjects:
Grades:
K - 2nd
Types:
Also included in: iReady 2020 Update Bundle - Supplemental Resources for 1st Grade Math
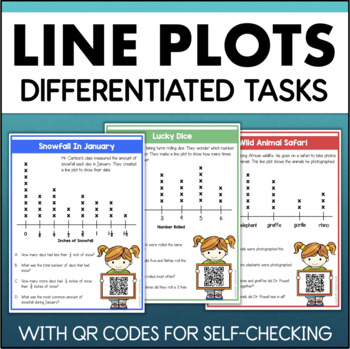
LINE PLOT Practice Activities with Fractions & Data Task Cards Worksheets
This math resource provides a scaffolded introduction to using line plots for organizing and interpreting data. The activities move from simple categorial data to more complex line plots with fractions.Each full-page card includes a data set presented in a line plot, along with 4 questions for students to answer. These questions require students to interpret and compare the data. FEATURES OF THIS RESOURCE:differentiatedability to self-checkdigital versionINCLUDES:There are 15 line plot cards div
Subjects:
Grades:
2nd - 4th
Types:
Also included in: Third Grade Math & Reading YEAR LONG BUNDLE 1500+ Pages
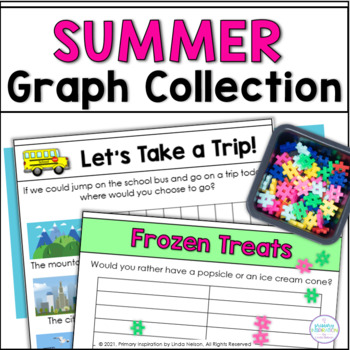
Summer Math - Bar Graphs and Tally Marks - June Activities - End of the Year
Celebrate the end of the year with a summer math festival featuring this set of 24 graphing and tally marks activities. These engaging bar graph and data analysis activities will keep your vacation-minded students learning all through June and in summer school, too!Use any or all of these graphing activities as stand alone activities or as part of your data and graphing unit, as either a whole class or small group activity. Here are some of the topics included in this summer math data collectio
Grades:
K - 2nd
Types:
Also included in: Summer School ESY Math and Literacy Bundle - June July Activities
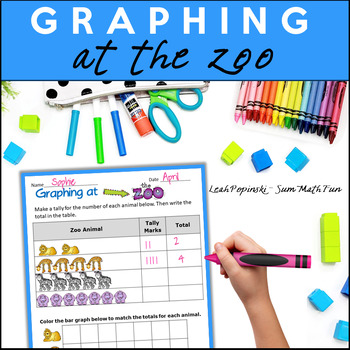
Zoo Animals Graphing Math Worksheets & Activities -A Zoo Field Trip PBL Activity
Are you taking a field trip to the zoo? You and your kids will LOVE these activities! They are PACKED with wildly cute animals and irresistible graphing worksheets! These No Prep Printables (also in the TpT Easel format!) will strengthen your students’ graphing skills using tally marks and bar graphs horizontally as well as vertically. And, the cute graphics are super motivating! See complete sample pages in the preview.⭐AS A HUGE TIME-SAVER FOR YOU - A COMPLETED EASEL VERSION IS INCLUDED IN YOU
Subjects:
Grades:
1st - 2nd
Types:
CCSS:
Also included in: Zoo Animals Activities Bundled | Zoo Graphing & Zoo Bingo Game
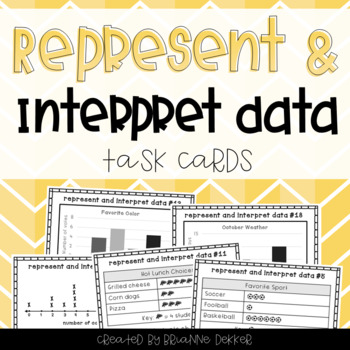
Represent and Interpret Data Task Cards
These 24 task cards target representing and interpreting data, aligned with the Grade 3 GoMath curriculum, Chapter 2. They include practice with reading and creating picture graphs and bar graphs as well as solving problems based on data, graphs, and line plots.
A recording sheet and answer key are included.
***
You might also be interested in:
- Represent and Interpret Data worksheets - $1
- Graphing the Weather Worksheets and Projects - $2
Would you like credit for future purchases?
Don'
Subjects:
Grades:
2nd - 4th
Types:
CCSS:
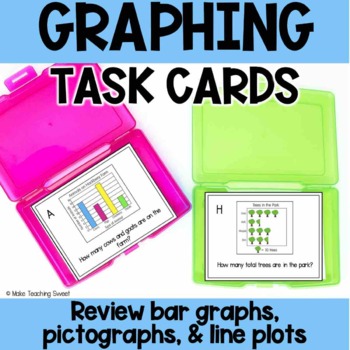
Graphing Task Cards - Interpreting Bar Graphs, Picture Graphs, Line Plots
Interpreting data doesn't have to be boring! Add these engaging task cards to your graphing unit! The task cards review bar graphs, pictographs, and line plots using these graphing task cards! Perfect to use as a whole group review, with a small group or in a math center. Teaching students to analyze data on graphs can be such a fun unit - but using the same graphs gets boring! Each task card features a different graph so your students will have a fun, hands-on way to practice reading graphs an
Subjects:
Grades:
1st - 4th
Types:
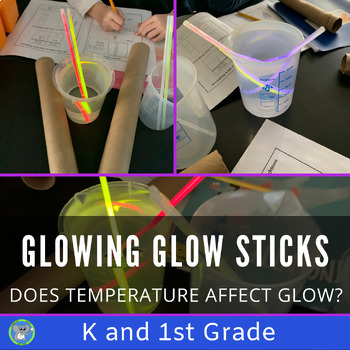
Glow Stick Light Experiment | Grade K 1 2 Chemical Reaction Science Activity
Excite students by investigating how temperature affects the brightness of glowsticks. This experiment uses simple supplies and includes detailed directions to guide the teacher and students. NGSS Aligned, fun, and perfect for Halloween.Students will follow the scientific method to answer the question:Does temperature affect the brightness of a glow stick? The journal meets the K-2 Science and Engineering Practices in NGSS.Teachers will like its’ ease of use, simple materials, and background inf
Subjects:
Grades:
K - 2nd
NGSS:
K-2-ETS1-3
, 1-PS4-2
Also included in: Chemical Reaction Bundle | The Science Of Glow Sticks | Light Activity
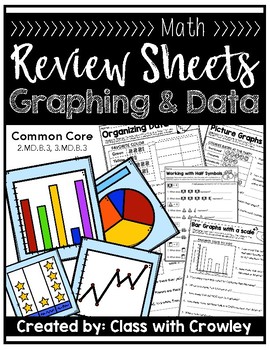
Graphing and Data (Review Sheets)
Easy... no prep... 37 Different review sheets to practice reading and interpreting graphing and data. Collecting data of your ownLabeling different tables, graphs and chartsFrequency Tables•Organizing data from a tally chart into a frequency table•Using a frequency table to answer one step questions•Using a frequency table to answer multi-step questions•Reading and interpreting multi-column frequency tablesPicture Graphs•Reading a picture graph w/no scale•Reading a picture graph w/ a scale•Using
Grades:
2nd - 4th
Types:
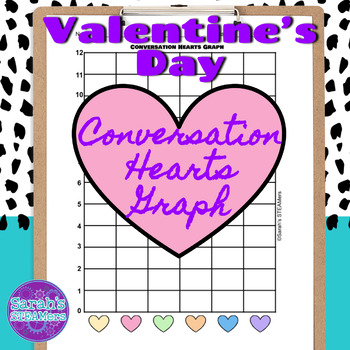
Valentine's Day Conversation Hearts Graphing Activity
What better way to incorporate math into your Valentine's Day than with a fun graphing snacktivity? This PDF contains a cover sheet, two graphs (one in color, one in B&W), and a question sheet. You can copy a graph and the question sheet back-to-back to save paper!You might also like:Sammy Cat: A Digital Escape RoomWriting Prompts Bundle2nd Grade Task Card BundleOpen The Box: Faith RinggoldPlants Mini Unit
Subjects:
Grades:
1st - 3rd
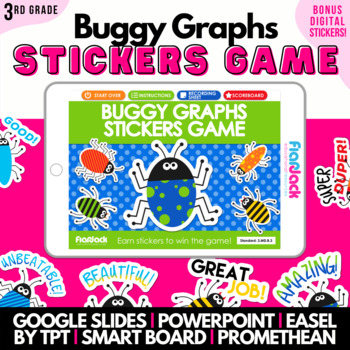
3rd Grade Graphing Math Game | Easel Google Slides PPT Smart Board Promethean
Interpret and complete bar graphs and picture graphs or pictographs in this fun, bug-filled math review game. This self-checking digital math game is based on the 3rd grade common core standard 3.MD.B.3.⭐️HEADS UP! You can get this digital game at 50% off in the 3rd Grade Digital Math Game Bundle containing 16 math games that are CCSS aligned.Game Features:☄common core aligned ☄20 questions☄self-checking☄great for distance remote learning☄scoreboard provided for interactive game play☄❤️BONUS❤️ d
Subjects:
Grades:
2nd - 4th
Types:
CCSS:
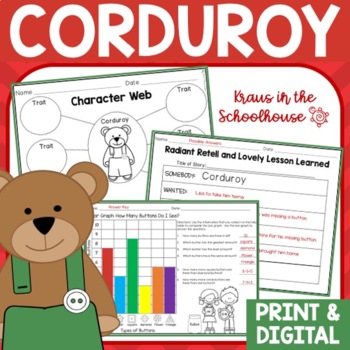
Corduroy Book Activities | Easel Activity Distance Learning
Printable and TpT digital activities are included for kids to use after reading Corduroy. Kindergarten, first grade, and second grade students will enjoy these fun activity sheets. This book study provides your students with reading, writing, and math activities. This resource has a Easel Activity for distance learning already created for students to input their responses in answer boxes and to use other tools to draw and highlight. It is an Interactive layer over the original pdf. Click he
Subjects:
Grades:
K - 2nd
Also included in: Book Study Bundle | Favorite Read Aloud Books | Picture Books
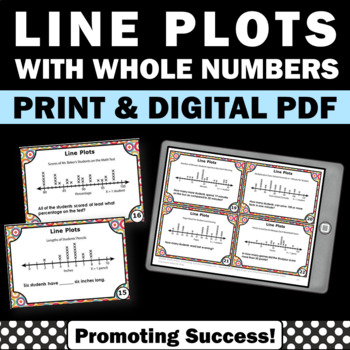
Line Plots Measurement Activities Interpreting Data and Charts Math Task Cards
DIGITAL PDF AND PRINTABLE PACKET: You will download 30 task cards (digital and print) for your 2nd or 3rd grade students to practice interpreting line plots with whole numbers. You may use the printable task cards in math centers or stations for fun practice and review games and activities, such as a scavenger hunt or SCOOT. They also work well for transition activities, as exit tickets, for morning work, and as quick formative assessments. Game ideas, a student response form and answer key are
Subjects:
Grades:
2nd - 3rd
Types:
CCSS:
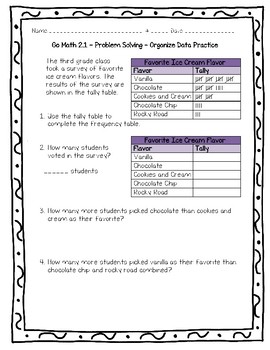
Go Math Practice - 3rd Grade Chapter 2 - Represent and Interpret Data
What's Included
Included in this pack are 9 worksheets on all the lessons in the Go Math book for chapter 2, a midchapter checkpoint practice sheet, and an end of the chapter checkpoint practice sheet.
I try to make each one 10 questions and on 1 page but due to the nature of this chapter (graphs and charts) there may be more or less.
These can be used as a quiz, formative assessment, homework, or just extra practice!
Answer keys are included for each worksheet.
Lesson 1: Problem Solving
Subjects:
Grades:
2nd - 4th
Types:
Also included in: Go Math Practice - 3rd Grade Worksheets For Entire Year Bundle
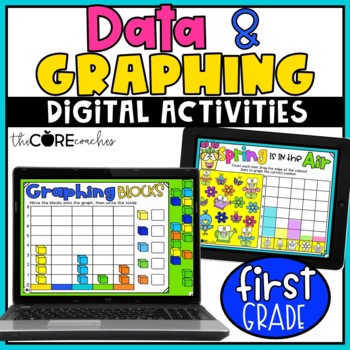
Data and Graphing - Digital Math Practice Activities - 1st Grade Math
These 20 independent digital graphing and data activities are meant to be assigned as extra math practice for students once they have been taught about tallying, reading, and recording data on bar graphs, picture graphs, and pie charts.The activities are compatible with Google Slides and Seesaw, and come preloaded and ready to implement. They are perfect for face-to-face instruction as well as distance or blended learning models.The digital activities can be assigned to students individually or
Subjects:
Grades:
1st - 2nd
Types:
Showing 1-24 of 206 results


