71 results
Common Core HSS-ID.C.9 resources $5-10
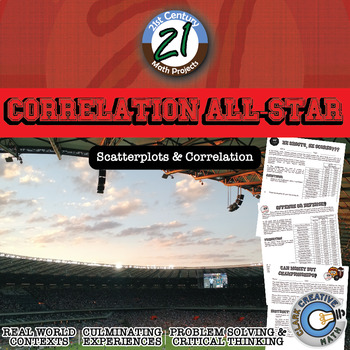
Correlation All-Star -- Sports Data Analysis - 21st Century Math Project
Bring an authentic sports-based math project to your Algebra, Algebra 2 or PreCalculus classroom with Lines of Best Fit and Correlations! All in this 21st Century Math Project! Using data from the MLB, NBA, NFL and NHL students investigate correlations to some of sports most common questions like: "Do more shots result in more goals?" "Do hitters or pitchers have more impact on a team's wins?""What NFL stat is most strongly correlated with wins?" and the grand-daddy..."Can money buy championship
Subjects:
Grades:
7th - 12th
Types:
CCSS:
![Preview of Statistics Final Exam and Review [AP, College, and Honors]](https://ecdn.teacherspayteachers.com/thumbitem/Statisticis-FinalReviewStudy-Guide-Exam-1711356723/original-699492-1.jpg)
Statistics Final Exam and Review [AP, College, and Honors]
You can use this Statistics Final Exam in an AP Statistics, Honors Statistics, or a College Statistics course as an assessment, review or both. What's Included?Included are 6 different versions, each including 60 well chosen representative questions in both multiple choice format and also in free response format*. These reviews and tests work well in class or as a take- home. The tests are editable with Adobe Acrobat Pro. Each test should take about 2 - 3 hours and can be taken with a graphin
Subjects:
Grades:
10th - 12th, Higher Education
Types:
CCSS:
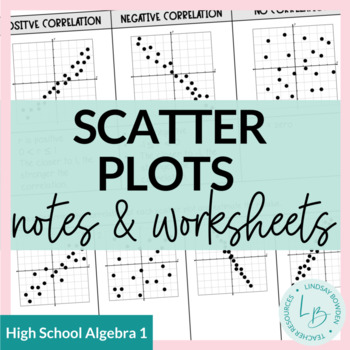
Scatter Plots Notes and Worksheets
These scatter plots notes and worksheets are meant for an Algebra 1 statistics unit. They cover:Linear, Quadratic, and Exponential Scatter Plots (very basic)Linear Scatter Plots in more detail Correlation CoefficientCorrelation vs. CausationLine of Best Fit (estimating from a graph)Linear Regression (using a graphing calculator)10 pages + answer keys.You may also like:Box and Whisker Plots Notes & WorksheetsHistograms Notes & WorksheetsTerms of Use:This product should only be used by the
Subjects:
Grades:
8th - 10th
CCSS:
Also included in: Statistics Unit Bundle
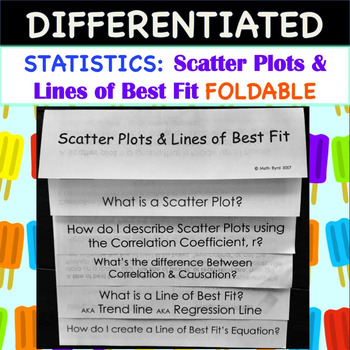
Statistics:Scatter Plots and Lines of Best Fit FOLDABLE
So Easy to Use! Simply print and fold! No need to rotate pages! Scatter Plots and Lines of Best Fit FOLDABLE also includes a PowerPoint to go along with the foldable.Foldable has 2 tiers of differentiation, perfect for the inclusive classroom! 1 set has fill-in-the-blank style notes within the foldable, while the other foldable has the notes already filled in. On both sets, students will have to work out the examples.Students will learn how to: Create Scatter PlotsDescribe Scatter Plots using Co
Subjects:
Grades:
8th - 11th
CCSS:
Also included in: Common Core Algebra 1: STATISTICS UNIT - BUNDLE PRICE!
Algebra 1 EOC Practice Test #1
Are you looking for a practice test for the Algebra 1 EOC? This practice test includes 60 EOC/FSA type questions. It has been created based on Florida Math Standards (MAFS) and Common Core Standards. The standards that are included are shown in the preview file. There is at least one question for each standard. The questions are based on the Florida Algebra 1 EOC Test Item Specifications. The standard groupings and reporting categories are based on the Florida Standard Assessment Test Desig
Subjects:
Grades:
8th - 9th
Types:
CCSS:
Also included in: Algebra 1 EOC Practice Test Bundle
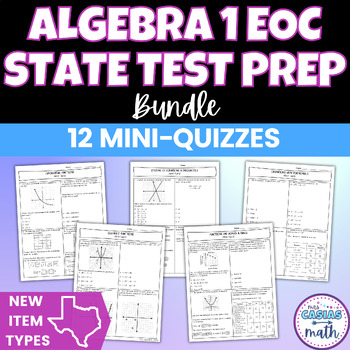
Mini Quizzes BUNDLE | Algebra 1 EOC Test Prep | STAAR New Item Types
Are you looking for Algebra 1 state test prep over the STAAR Redesign new item types? You will find it here with this Algebra 1 Mini Quizzes Bundle! This bundle includes 12 mini quizzes with four questions each - two questions over the new STAAR 2.0 question types and two multiple choice questions that are very similar to released STAAR questions.Here is a list of all that is included:Equations & Inequalities Mini-QuizFunctions and Domain & Range Mini-QuizLinear Relationships Mini-QuizLi
Subjects:
Grades:
8th - 9th
CCSS:
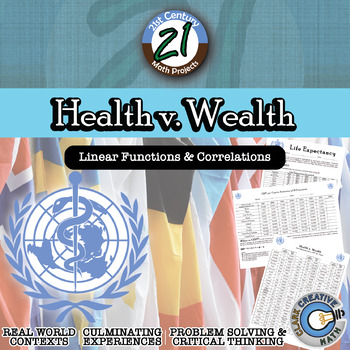
Health v. Wealth -- International Data & Correlation - 21st Century Math Project
Correlations and causation should be abundantly clear when students examine data of the Health and Wealth of over 80 nations around the world. The world is ever-changing and it is important for students to have a basic level of global awareness. In this 21st Century Math Project, students will use real world data to model regression functions, examine correlations and predict the future. In this project students will investigate global data sets to examine potential correlations related with the
Subjects:
Grades:
7th - 12th
Types:
CCSS:
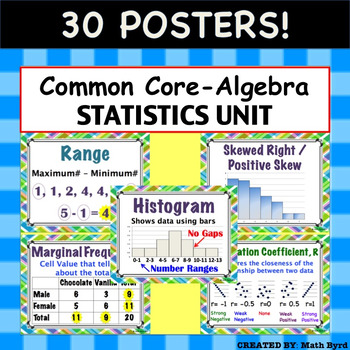
Common Core Algebra - Statistics Unit: Describing Data POSTERS
30 Posters! Each 8.5" x 11" in size. Posters are aligned with Common Core's Algebra - Statistics: Describing Data Unit. Posters Included:MeanMedianModeRangeInterquartile RangeOutlierMean Absolute DeviationMeasures of CenterMeasures of SpreadDot PlotHistogramBox PlotNormal/ Bell Shaped DistributionSkewed Right/Positive SkewSkewed Left/ Negative SkewUniform2 Way Frequency TableJoint FrequencyMarginal Frequency2 Way Relative Frequency TableConditional Relative FrequencyScatter PlotCorrelationCorrel
Subjects:
Grades:
8th - 11th
CCSS:
Also included in: Common Core Algebra 1 POSTERS - BUNDLE PRICE!
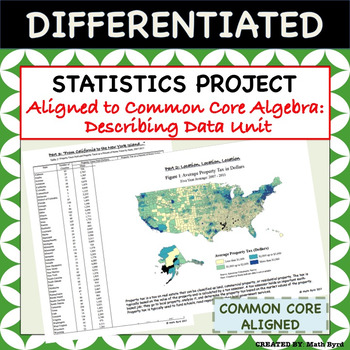
Statistics Project - Aligned to Common Core Algebra - Describing Data Unit
This differentiated U.S. Home Energy & Tax Themed Statistics Project covers all of the "describing data" standards of the Common Core Algebra Course using real data! Students will analyze various forms of tables & graphics to make inferences and interpret the data. The project is perfect for use as a summative assessment since students are required to justify their findings in open-ended format. Allow students to work in pairs, small groups, or individually! A grading rubric and selected
Subjects:
Grades:
8th - 11th
Types:
CCSS:
Also included in: Common Core Algebra 1 PROJECTS - BUNDLE PRICE!
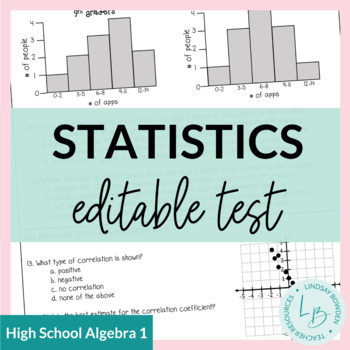
Statistics Test with Study Guide
This resource includes a statistics unit test and study guide for an Algebra 1 statistics unit.The editable versions are PowerPoints where you can edit text as needed.Topics covered:Histograms, Dot Plots, Box and Whisker PlotsRange, Interquartile RangeMean Absolute DeviationTwo-Way Frequency TablesScatter Plots and CorrelationLine of Best Fit There are 20 multiple choice questions and 10 free response questions. Test and answer documents are divided so that if you only wanted to give the multipl
Subjects:
Grades:
8th - 10th
Types:
CCSS:
Also included in: Statistics Unit Bundle
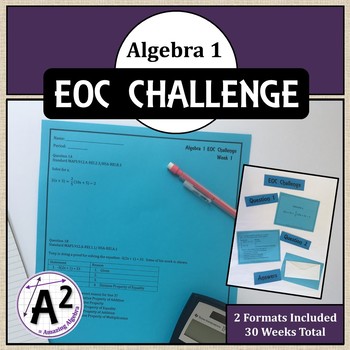
Algebra 1 EOC Challenge
Do you want to introduce standardized test questions throughout the year? The EOC Challenge meets Florida Math and Common Core Standards for Algebra 1. It introduces challenging questions as they are taught and allow students to see these types of questions from the beginning. This product contains 60 EOC type questions which is designed to be a complete practice test. It is a great way to introduce EOC format questions without overwhelming students. The questions are organized in the order
Subjects:
Grades:
8th - 9th
Types:
CCSS:
Also included in: Complete Algebra 1 EOC Preparation Bundle
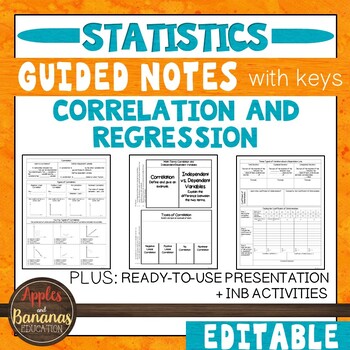
Correlation and Regression - Guided Notes, Presentation, and INB Activities
This Correlation and Regression (Statistics) product is flexible, editable, and can be used for in-person or distance learning. It includes guided notes embedded with student practice problems (keys included), foldable activities, and a PowerPoint presentation for focused instruction. Choose what works best for your class/student and modify to make the content fit your needs. Notes are designed to clearly present the topics and reach all types of learners. Take the time and stress out of creatin
Subjects:
Grades:
9th - 12th
CCSS:
Also included in: Custom Bundle for Viet
High School SBAC Assessment Practice Test - (Google Forms™ and Paper Included)
About This Resource:We all have the pressure of our students performing well on the SBAC. It can be a very intimidating test! I have spent countless hours researching the SBAC summative assessment blueprint and creating items that meet the rigor of the item specifications. Your students will be fully prepared for the test with this resource!What's Included:Claim 1 Practice Test already set up in Google Forms with auto gradingClaim 1 Practice Test in Paper formatClaim 1 Answer Key in PDF formatCl
Subjects:
Grades:
9th - 12th
Types:
CCSS:
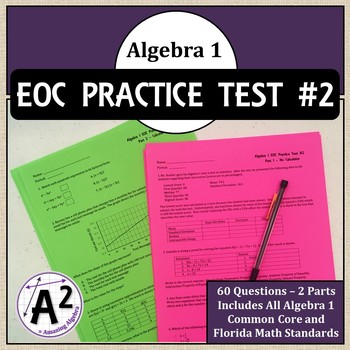
Algebra 1 EOC Practice Test #2
Are you looking for a practice test for the Algebra 1 EOC? This practice test includes 60 EOC/FSA type questions. It has been created based on Florida Math Standards (MAFS) and Common Core Standards. The standards that are included are shown in the preview file. There is at least one question for each standard. The questions are based on the Florida Algebra 1 EOC Test Item Specifications. The standard groupings and reporting categories are based on the Florida Standard Assessment Test Desig
Subjects:
Grades:
8th - 9th
Types:
CCSS:
Also included in: Algebra 1 EOC Practice Test Bundle
Bundle: Algebra I Statistics Digital Task Cards (84 Cards)
Distance Learning: Algebra I Statistics Digital Task Card Bundle These digital task cards are adapted from the printable version of Algebra I Statistics Task Card Bundle available here. This product is a bundle that includes 4 sets of Common Core-Aligned digital task cards (84 cards total) each created in Google™ Forms. These digital task cards are perfect for distance learning, independent work, graded assessments, or practice. This resource includes answer key with feedback, multiple editable
Subjects:
Grades:
8th - 12th
Types:
CCSS:
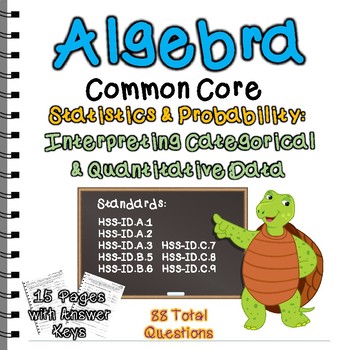
Interpreting Categorical and Quantitative Data Common Core Standards
This item is included in the following bundle:High School Algebra Common Core Standards Practice BUNDLE PACKThis item includes 8 student worksheets (7 are 2-page documents) by common core standard. There are a total of 15 pages containing 88 questions.Standards in this document are from the Probability & Statistics Standards:HSS-ID.A.1: Represent data with plots on the real number line (dot plots, histograms, and box plots).HSS-ID.A.2: Use statistics appropriate to the shape of the data
Grades:
7th - 12th
CCSS:
Also included in: High School Algebra Common Core Standards Practice BUNDLE PACK
Bundle Task Cards Statistics Algebra I (84 Cards) (Common Core Aligned)
Algebra I Statistics Task Card Bundle (84 Cards) (Common Core Aligned) This product is a bundle that includes 4 sets of Common Core-Aligned task cards (84 cards total) each with a recording sheet and answer key. These task cards only require two cuts per page! The sets of task cards can also be purchased a la carte. Bundle Bonuses: We’re offering the bundle at a discount of almost 25% off of the a la carte price.That’s purchasing 3 sets of task cards and getting the 4th set free! Algebra I Sta
Subjects:
Grades:
8th - 12th
Types:
CCSS:
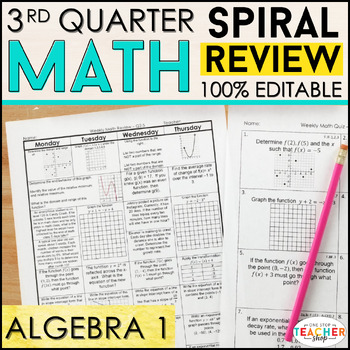
Algebra 1 Review & Quizzes | Homework or Warm Ups | 3rd QUARTER
This Algebra 1 spiral review & quiz resource can easily be used as HOMEWORK, WARM-UPS, or a DAILY MATH REVIEW! This resource was designed to keep math concepts fresh all year and to help you easily track student progress. All pages are 100% EDITABLE and easy to differentiate to fit your students' needs.☝☝ Check out the Preview for more details and 3 FREE Weeks! ☝☝Get the ENTIRE YEAR BUNDLE! {CLICK HERE}★★★★★★★★★★★★★★★★★★★★★★★★★★★★★★★★★★★★★★★★★★★★★★★★★★★★★★★★★★★★★Go 100% Paperless with my GOO
Subjects:
Grades:
8th - 9th
Types:
CCSS:
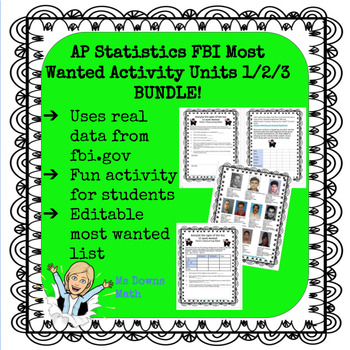
FBI Most Wanted AP Stat - Analyze Data, Normal Distributions, Linear Regression
I have created a series of activities for several units in the AP Statistics curriculum. The students love using data from fbi.gov to review concepts. This activity involves analyzing data related to the top 10 most wanted fugitives. I created this activity in May of 2020 and used the top 10 at that time. In the folder, you will find an editable slide of the top 10 if you want to change it.The answer key for the unit is based on the original top 10 that I used. Teachers have the option of having
Subjects:
Grades:
10th - 12th
Types:
CCSS:
High School Math IEP Goal Bank - Statistics and Probability
This IEP goal bank was created to assist special education teachers with the task of writing standards-based IEP goals in math. After spending countless hours developing IEP goals myself and really having to think through how to best individualize goals and objectives for my own students, I wanted to share this resource to help other special education teachers gain back some of their time.This goal bank includes the following:An introduction and guide that explains how to use the document.Each s
Subjects:
Grades:
9th - 12th
CCSS:
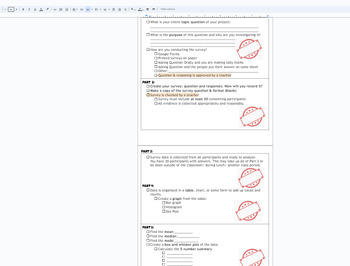
Statistics Survey project Discovery (broken down into sections) with Rubric
This is a broken down (scaffolded) packet of instructions/ guide for a Stats Project for Math 1 HS or 8th grade students. The goal of the project is for students to take a statistical survey on quantitative data (numbers) of their choice. Using this data from the survey, the following will be included in the project:Survey- the question being askedSurvey responses (requirement of 30)Data organization: Bar chart, Histogram, Dot PlotMeanMedianModeBox and Whisket Plot5 number summary (Q1,Q2,Q3, min
Subjects:
Grades:
7th - 12th, Higher Education, Adult Education
CCSS:
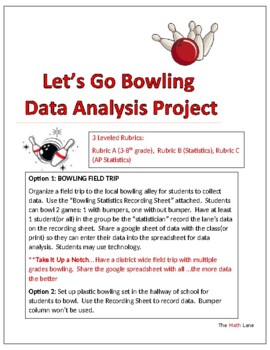
Let's Go Bowling Statistics STEM Project & Field Trip (3-12 and AP Stat)
Great END OF YEAR project. Get ready to strike up some fun with your students on a field trip to the bowling alley or right in your own hallway with a plastic bowling set! This isn't just any ordinary field trip - it's a real-world data collection extravaganza. 3 different leveled rubrics (Grade 4-10, Statistics, AP Statistics) so students can analyze the data based on their math knowledge. Students will be able to practice creating and analyzing graphical displays, scatterplots, construct c
Subjects:
Grades:
Not Grade Specific
Types:
Also included in: High School Statistics Project Bundle
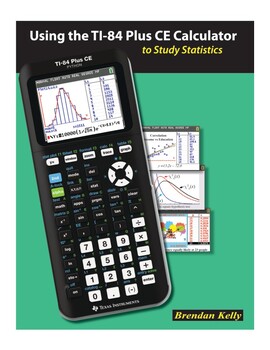
Using the TI-84 Plus CE Graphing Calculator to Study Statistics
Using the TI-84 Plus CE Calculator to Study StatisticsISBN 978-1-895997-59-0(102 pages; 8.5” x 11” trim size)The information age has made statistics one of the most important branches of mathematics. The ubiquity of real-world data enables us to explore statistical concepts using real data from interesting and current sources. As they work through the exercises in this book, students enter real data onto spreadsheets or into statistical plots on the TI-84 Plus CE Calculator while you guide their
Subjects:
Grades:
10th - 12th, Higher Education
Types:
CCSS:
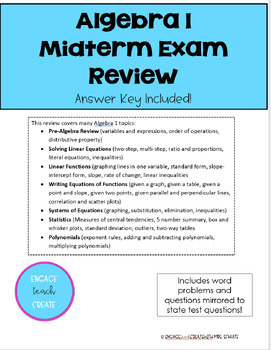
Algebra 1 - Mid-Term Exam Review with Key
This review covers many Algebra 1 topics: · Pre-Algebra Review (variables and expressions, order of operations, distributive property) · Solving Linear Equations (two-step, multi-step, ratio and proportions, literal equations, inequalities) · Linear Functions (graphing lines in one variable, standard form, slope-intercept form, slope, rate of change, linear inequalities· Writing Equations of Functions (given a graph, given a table, given a point and slope, given two points, given parallel and pe
Subjects:
Grades:
8th - 11th
Types:
CCSS:
Showing 1-24 of 71 results

