27 results
Free Common Core HSS-ID.C.9 resources
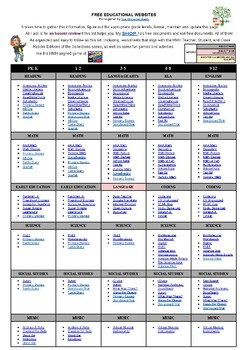
FREE EDUCATIONAL WEBSITES LIST 4 ALL GRADES K-12 AND SUBJECTS + TEACHER RESOURCE
Sometimes, you just need a list of websites for everyone. Here it is. FREE EDUCATIONAL WEBSITES Put together by Teach Me, Maria!It takes time to gather this information, figure out the appropriate grade levels, and format, maintain, and update this page. All I ask is for an honest review if this list helps you.
Subjects:
Grades:
PreK - 12th, Staff
Types:
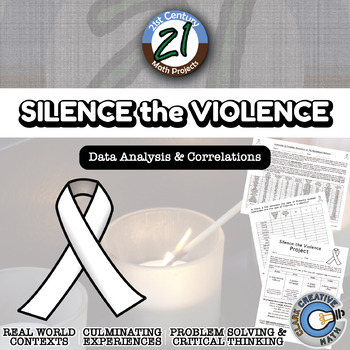
Silence the Violence -- International Data Analysis - 21st Century Math Project
Silence the Violence intends to take a closer look at gun violence throughout the world. Is there a correlation between gun ownership and gun violence? While this is on the news, and people argue back and forth, unfortunately there are not a lot of statistics cited.I built this project through the use of correlations of authentic international data. I have included content for either middle school (plotting and calculating) or high school (calculating correlation with summations). The results ar
Subjects:
Grades:
6th - 12th
Types:
CCSS:
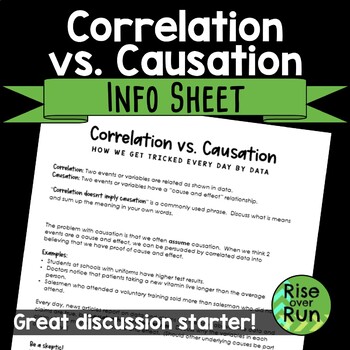
Correlation vs. Causation Information Sheet Freebie
Help students distinguish between causation and correlation. This info sheet give definitions and examples of correlation that are often called causation. It is a great way to start discussions and get students thinking. The page explains why causation is difficult to prove and how a study would need to have a control group. Students are prompted to look for real articles and point out correlation being used to imply causation (which happens a lot)!
Subjects:
Grades:
8th - 11th
Types:
CCSS:
Also included in: 8th Grade Math Activities & Lessons Bundle for the Whole Year
Common Core Algebra I - Unit #10.Statistics
Standard statistical displays of data are reviewed at the beginning of the 10 lesson unit. Box plots are used to compare data sets and emphasize use of the quartiles and interquartile range. Measures of central tendency and dispersion, such as mean and standard deviation, are discussed and interpreted in real world scenarios. Two way frequency charts are used to compare data and bivariate data analyses allow the fitting of data with linear and exponential functions.To access the lesson videos on
Subjects:
Grades:
8th - 10th
CCSS:
10 Free Big Brain Math Problems
This is a sample of the 100 and 180 Big Brain Math Problem I have created with a couple of my students. I write these problems on the window of my classroom everyday and get about 5-10 students a day coming to try to solve them. It's been an enjoyable experience to have students come try the problem of the day and share their solutions with me. Please consider purchasing the 100 or 180 Big Brain Math Problems. There's enough for one a day for the entire school year and range from 1-5 Star diffic
Subjects:
Grades:
9th - 12th
Types:
CCSS:
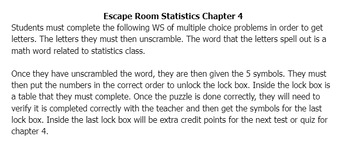
Statistics Scatter Diagram and Linear Regression Escape Room
This escape room is meant to be used with physical breakout boxes. It covers scatter diagrams and linear regression. This is for basic or elementary statistics, not AP statistics. Activity varies on time depending on skill level. I use it for my junior and senior students.Material covered: Linear regression, correlation coefficient, coefficient of determination, interpolation, extrapolation, and residuals.
Subjects:
Grades:
11th - 12th
Types:
CCSS:
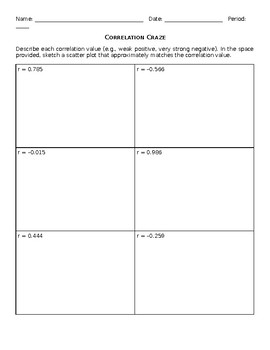
Worksheet: Correlation Craze
This worksheet asks students to determine the strength (strong, moderate, weak) and direction (positive, negative) of correlation coefficients and sketch corresponding scatter plots. Additionally, students differentiate between correlation and causation by discussing the relationship between two variables of their choice.
Subjects:
Grades:
9th - 12th
Types:
CCSS:

Which One Does Not Belong? Scatterplots
Which One Does Not Belong (or WODB) activities are quick and easy to use as warm ups, discussion starters, and lesson openers or closers. The beauty of WODB is that there is no one right answer or wrong answer. WODB spark discussions that can help deepen conceptual learning. Project the slide on a screen for whole class discussion or small groups. Upload the activity to student learning platforms such as Google Classroom and use it in the discussion board feature. Encourage students to use math
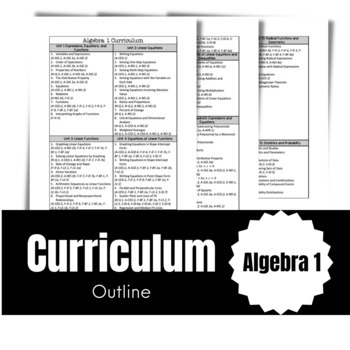
Algebra 1 Curriculum Outline
This product is associated with the content that goes with the Algebra 1 Curriculum. This also includes the Common Core Standards that go with each section in each unit. Unit notes, worksheets, reviews, and tests will be posted in the next few weeks. I will also link them here.
Subjects:
Grades:
9th - 10th
CCSS:
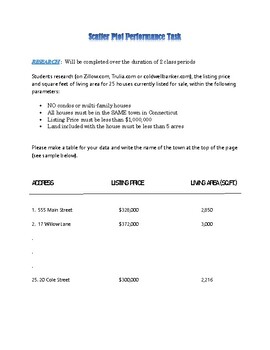
Scatter Plot Performance Task - Houses for Sale
Students will research houses that are for sale and will compare listing price and square footage of living space. They will create a scatter plot, write the equation of the line of best fit, use their equation to extrapolate square footage for a $1 million house, and identify any relationship between the data.
Grades:
8th - 9th
Types:
CCSS:
Passion-Driven Statistics E-book (Introductory/AP Statistics Course Textbook)
Passion-Driven Statistics is an NSF-funded, multidisciplinary, project-based curriculum that supports students in conducting data-driven research, asking original questions, and communicating methods and results using the language of statistics. The curriculum supports students to work with existing data covering psychology, health, earth science, government, business, education, biology, ecology and more. From existing data, students are able to pose questions of personal interest and then use
Subjects:
Grades:
6th - 12th, Higher Education, Adult Education
Types:
Math Exit Slip for Grades 7-10
Just want to share this gorgeous ONLINE math exit slip that's built like a Kahoot! It's super easy to use and comes with auto-generated math questions for Grades 7-10 that are based off Singapore maths curriculum... My students love it :-) Best part is you don't even need to create an account to use it. Absolutely free.https://mentor.joni.ai/slipI have also included a PDF that introduces some of the other features if you sign-up for a Mentor account.
Subjects:
Grades:
7th - 10th
Types:

Financial Algebra Chapter 1 Study Guide
This is a study guide based on lessons 1-1, 1-2, and 1-5 of the text book Financial Algebra by Gerver and Sgroi. The topics covered are discretionary expenses with statistics applications.
Grades:
9th - 12th
Types:
CCSS:
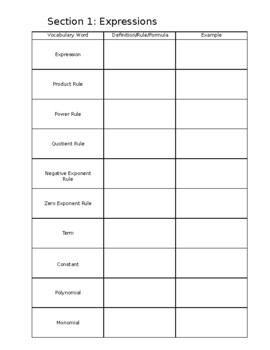
Algebra 1 EOC Vocabulary
Algebra 1 Vocabulary from each section. Completely edited. Answer key will be provided by 5/1.
Subjects:
Grades:
8th - 12th
Types:
CCSS:
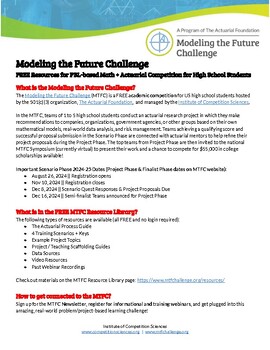
Flooding Losses Math Modeling Training Scenario (Instructor Version+Answers)
This is a training scenario that was created for the Modeling the Future Challenge (MTFC), a FREE problem/project-based learning competition for high school students. The DATA SET can be found here.This is one of many free resources that are available through the MTFC and is a fantastic opportunity for high school students to apply math concepts, have an authentic audience and mentors, and engage in interdisciplinary problem-solving work while competing for college scholarships. We invite you yo
Subjects:
Grades:
9th - 12th
CCSS:
Ohio Learning Standards (OLS) for Stats + 'I Can' Statements
Are you required to use the content standards on your lesson plans? And the 'I Can' statements? This product lists the 8 Mathematical Practices, an overview of the Statistics Learning Standards, and then the standards, each one accompanied by an 'I can' statement. The OLS are almost exactly the same as the Common Core State Standards, but for a little bit of the language and the notation. Oh, and this is FREE!
Grades:
10th - 12th
CCSS:

Dr. Wimpey's Quick Reference for Statistics
I created this all-in-one document/foldable to help my statistics classes. It contains definitions, procedures, etc. It is useful for AP, honors, and CP levels in high school as well as college introductory statistics courses.
Subjects:
Grades:
11th - 12th, Higher Education
CCSS:
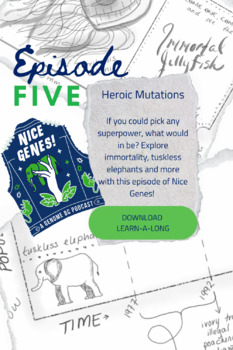
Learn-a-long: 'Nice Genes!' Episode 5
The download is a PDF for students to help follow along with Episode 5 of the Nice Genes! Podcast found HEREJust like any good superhero comic, we start this episode with the science going incredibly wrong. Think: vats of toxic waste producing evil mutants that ravage the city. Or maybe not so evil. It really depends on your perspective. Just like the X-men, genetic mutations get a bad rap in the public eye. But they aren’t all nasty.Dr. Kaylee Byers speaks with data scientist and evolutionary b
Subjects:
Grades:
8th - 12th, Higher Education, Adult Education
Types:
CCSS:
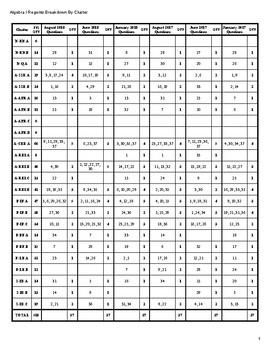
Algebra I Regents Breakdown By Cluster
Plan smarter! This document breaks down the Algebra I regents by cluster. Know which cluster is tested most on the Algebra I regents and plan accordingly. No more guessing which standards you should spend more time on.
Subjects:
Grades:
9th
Types:
CCSS:
SPSS software Secondary Data Analysis Workshop (Introductory/AP Statistics)
This handout is intended for those interested in teaching/learning basic introductory statistics concepts to analyze real data. Students will learn how to tell a story using secondary data analysis. The handout is for SPSS and the US Longitudinal Study of Adolescent Health data set. For handouts on the data set code book and raw data file, a PowerPoint to accompany the handout, or questions please email kristin.flaming@gmail.com or ldierker@wesleyan.edu.This handout was developed as a condensed
Subjects:
Grades:
6th - 12th, Higher Education, Adult Education
Types:

Earth's Rotational Axial Tilt at 23.5
This is 4 Virtual labs on the Earth's Rotational Axis at 23.5 degrees during March, June, September and December at Key Latitudes, Polar Circle, Tropics, the Equator, 35N and 41N.
Subjects:
Grades:
9th - 12th
Types:
CCSS:
NGSS:
HS-ESS1-4
, HS-ESS3-1
Translation Code
As part of our NSF-funded passion-driven statistics project, we have just started to share more widely our “translation code” aimed at supporting folks in learning code-based software and in moving more easily between them. The pdf includes all of the basic syntax for managing, displaying and analyzing data, translated across SAS, R, Python, Stata and SPSS. http://bit.ly/PDSTranslationCode.For more information about our warm and welcoming data-driven curriculum, check out https://passiondrivenst
Grades:
6th - 12th, Higher Education, Adult Education
Types:

R software Secondary Data Analysis Workshop (Introductory/AP Statistics)
This handout is intended for those interested in teaching/learning basic introductory statistics concepts to analyze real data. Students will learn how to tell a story using secondary data analysis. The handout is for R or R Studio, a free cloud based system and the US Longitudinal Study of Adolescent Health data set. For handouts on setting up a free R account, the data set code book and raw data file, a PowerPoint to accompany the handout, or questions please email kristin.flaming@gmail.com or
Subjects:
Grades:
6th - 12th, Higher Education, Adult Education
Types:
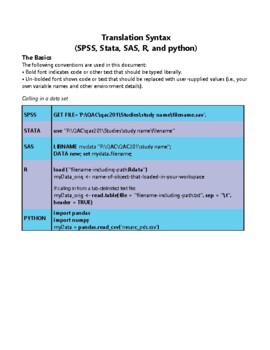
STATA software Secondary Data Analysis
This handout is intended for those interested in teaching/learning basic introductory statistics concepts to analyze real data. Students will learn how to tell a story using secondary data analysis. The handout is for STATA software and the US Longitudinal Study of Adolescent Health data set. For handouts on setting up an account, the data set code book and raw data file, a PowerPoint to accompany the handout, or questions please email kristin.flaming@gmail.com or ldierker@wesleyan.edu.This
Grades:
6th - 12th, Higher Education, Adult Education
Types:
Showing 1-24 of 27 results

