5 results
Adult education algebra 2 resources for Microsoft Excel

Parabola Transformations - Interactive
A handy guide to help new students learn how each change affects the shape and direction of parabolas. Clear color coding for the various pieces of the formula and instant updates help separate and isolate the concepts for easy, intuitive learning.Enter information using simple dropdown menus and organized blank fields to isolate each piece of the formula!Two tabs:One allows you to enter individual pieces of information to show the resulting formulaOne allows you to enter the formula to show the
Subjects:
Grades:
7th - 12th, Higher Education, Adult Education

Quadratic Graph Maker (Excel Templates)- Standard, Vertex, and Factored Forms
Easily Generate a Quadratic Graph/Parabola from a Template for Worksheets/Lessons/Notes:The Quadratic Graphing Template Excel file allows you to enter values into a table of values to easily create graphs of parabolas for any of the three forms (standard form, vertex form, factored form); all three forms of the equation are contained in one Excel file.The template is designed to include the vertex and 8 points before and after the vertex (the coordinates of the vertex in the table of values are
Subjects:
Grades:
9th - 11th, Adult Education, Staff

graph plotter for quadratics
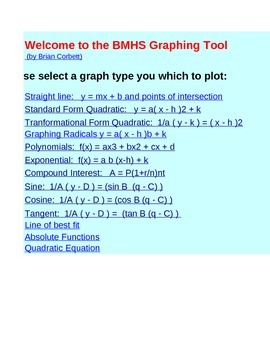
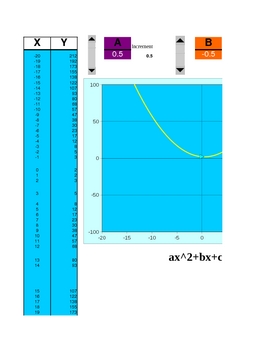
This is a handy graph plotter for teaching quadratics and polynomials. You can change the variables and the student sees the plot right away so they can see how the coefficients affect the graph.
also, line of best fit,
Sin, Cos and Tan
quadratic equation
Yo can also use it to create a graph and copy and paste it to a test document and get the students to come up with the equation.
Subjects:
Grades:
9th - 12th, Higher Education, Adult Education, Staff
Types:

Functionator 5000 A graphing calculator/equation editor decay & growth
I built this Excel document to show what happens to lines and tables when you change variables and constants within an equations. There are three sheets:
y = mx+b
ax^2 + bx +c =0
c = p(1-r)^t
For instance, on the linear equation sheet, you can change m & b separately to see changes in the table and the graph. You can trace all equations. Much fun can be had.
Subjects:
Grades:
5th - 12th, Higher Education, Adult Education
Types:

Math Video List - MUST HAVE!!!
Online Videos (800+) catalogued by topic everything from Pre-Algebra to Pre-Calculus. Just press Crtl + F and type in a keyword. This is an INVALUABLE resource for every math educator.
Subjects:
Grades:
4th - 12th, Higher Education, Adult Education
Showing 1-5 of 5 results


