29 results
High school algebra 2 simulation microsofts
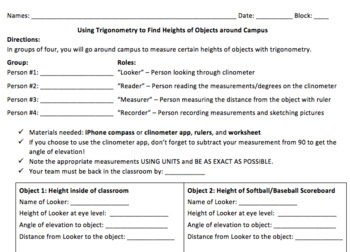
Measure Objects Using Trig - Clinometer Activity
This guided worksheet is the perfect lesson for students to experience trigonometry around their schools! Students can use the compass app on their iphones to measure the angles of elevation to calculate heights of different objects around campus.
Subjects:
Grades:
9th - 12th
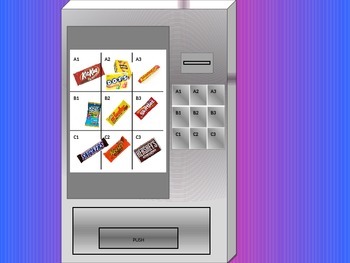
Non Functional Vending Machine
This powerpoint is used to engage students before learning about functions. When you click on a number it will go to the coresponding candy. If you press the push button on the machine it will lead you to a table. The A2 button is special, if you click on the A it will lead to the Pops candy. If you click on the 2 it will lead to the Dots. (This is the non function part) You can ask the students is this a functional vending machine. They will say no because when you pressed the A2 button you got
Grades:
9th - 12th
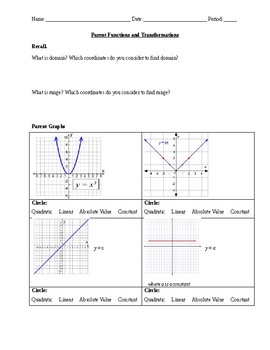
Transformations Discovery Activity
This is a discovery activity dealing with transformations of absolute value graphs, constant graphs, linear graphs, and quadratic graphs. Students will use sliders on Desmos Online Graphing Calculator to see how each variable affects the parent graph of a function. Students will then draw conclusions and answer questions about similar functions without looking at the graph based on what they discovered. Note: You will need computers. We suggest pairing students in groups of two.
Grades:
9th - 11th
Types:
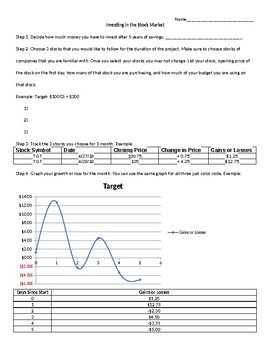
Investing in the Stock Market
This project was created for a consumer math class. It has the students selecting 3 stocks, and buying different amounts based on their budget (I chose budgets and had them draw from a hat). Students will then track the 3 stocks for a month (I have them back track dates on Yahoo! Finance's History tab), and then graphing their gains or losses. Students will then finish by summarizing their month.
Subjects:
Grades:
9th - 12th
Types:
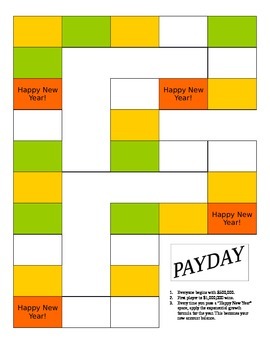
Payday - Exponential Growth Board Game for Algebra
Payday is an awesome interactive board game similar to the game of Life. Students start with $400,000 and life events cause them to gain or lose money. At the end of each year, students calculate the yearly exponential growth to get their new balance. The first student to $1,000,000 wins.
Students are involved and excited to play this game. This is a good formative assessment tool to see if student understand this algebraic topic. The student score sheet is a way to collect their work and asse
Subjects:
Grades:
9th - 12th
Types:
CCSS:

Fireworks Show Entry Doc for Algebra I or II (Quadratics Project PBL)
Engage your math students in authentic, real world learning by helping them plan a fireworks show! This product includes two versions of an entry document to launch a PBL unit on quadratics. The document is a Microsoft Word Doc so you can make edits where needed. The first includes a more detailed plan for Algebra II students who will cover vertex, standard, and intercept form, transformations of quadratics, and solving equations with factoring, complete the square, and the quadratic formula. Th
Subjects:
Grades:
8th - 11th
Types:
Also included in: Quadratics Resource Bundle (PBL PrBL Explorations + Projects)

Comparing Linear, Quadratic, Exponential Regressions w/Spreadsheets
This project incorporates spreadsheets with scatter plots and lines of best fit. It asked students to perform various regressions, such as linear, power, exponential, and logarithmic, The students are asked to generate an model to help park rangers determine the weight of black bears by using only one of three measures, neck girth, length, and chest girth. Calculating the bears weights allow the rangers to anesthetize them in order for them to care for the bears. The r values in this project
Subjects:
Grades:
9th - 12th
Types:
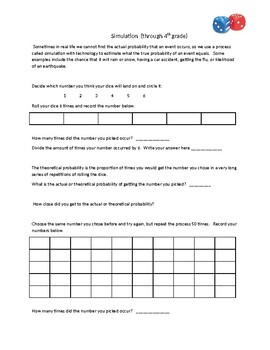
Probability Intro to simulation using dice
This is the perfect introductory activity to simulation and probability. It could be used in Algebra 2 and basic Statistics courses. It could also be used in 6th through 8th grade to introduce probability.
Subjects:
Grades:
6th - 12th
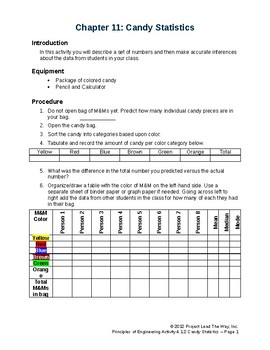
Candy Statistics
Kids have a chance to open individual bags of M&Ms and practice calculating probability of different colors and solving probability problems both independent and dependent.
Subjects:
Grades:
9th - 12th
Types:
Math in the News: Issue 107
In this issue of Math in the News we explore logarithmic functions to model the thawing of frozen turkeys. We look at USDA guidelines to determine data points and use a graphing calculator to create mathematical models.
This holiday-themed real-world application will create a unique context for exploring logarithmic functions.
Media4Math.com has thousands of additional digital resources for math.
Subjects:
Grades:
9th - 12th
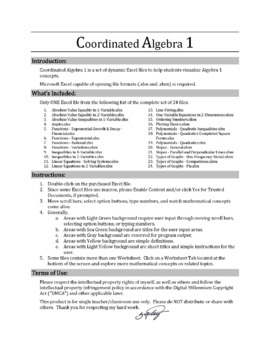
Demonstrate Exponential Functions with an Animated Excel File
Simple to use animated Excel file for in class demonstration of exponential function graphs, specifically, growth, decay, f(x)=ab^x, vertical shift, horizontal shift, and f(x)=ab^(x-h)+k. Move scroll bars, select option buttons, type numbers, and watch these mathematical concepts come alive. You must use Microsoft Excel that is capable of opening file formats in either .xlsx or .xlsm.
Subjects:
Grades:
9th - 12th
Types:
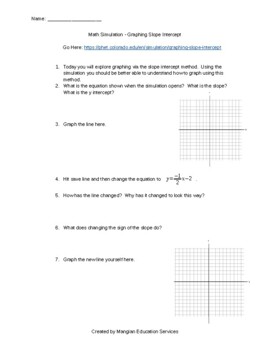
Virtual - Slope Intercept Learning Simulation
Using the simulation by phet, students can better understand how changing the slope and y intercept change their graphs.
Subjects:
Grades:
7th - 10th
Types:
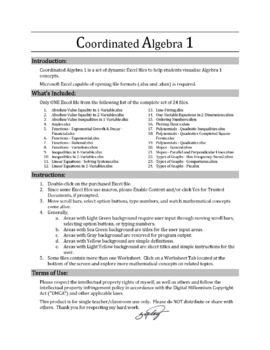
Demonstrate Linear Equations in 2 Variable Graphs with an Animated Excel File
Simple to use animated Excel file for in class demonstration of Linear Equations in 2 Variables. Equation formats include general form, slope-intercept form, point-slope form, and point-point form. Move scroll bars, select option buttons, type numbers, and watch these mathematical concepts come alive. You must use Microsoft Excel that is capable of opening file formats in either .xlsx or .xlsm.
Subjects:
Grades:
8th - 12th
Types:
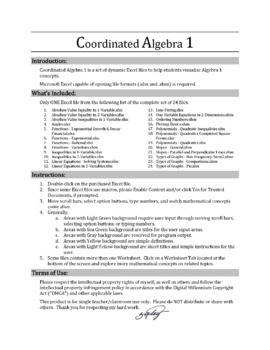
Demonstrate Quadratics in Completed Square Graphs with an Animated Excel File
Simple to use animated Excel file for in class demonstration of graphing quadratics in completed form such as y=ax², y-k=ax², y=a(x-h)², and y-k=a(x-h)². Move scroll bars, select option buttons, type numbers, and watch these mathematical concepts come alive. You must use Microsoft Excel that is capable of opening file formats in either .xlsx or .xlsm.
Subjects:
Grades:
9th - 12th
Types:
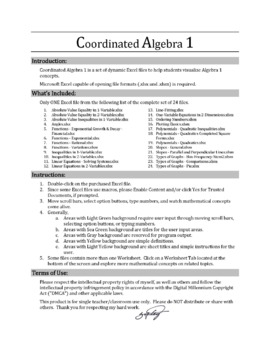
Demonstrate One-Variable Equations in 2-Dimensions with an Animated Excel File
Simple to use animated Excel file for in class demonstration of One-Variable Equations in 2-Dimensions. Graph types include vertical (x=c), horizontal (y=c), and both types on one graph. Move scroll bars, select option buttons, type numbers, and watch these mathematical concepts come alive. You must use Microsoft Excel that is capable of opening file formats in either .xlsx or .xlsm.
Subjects:
Grades:
7th - 12th
Types:
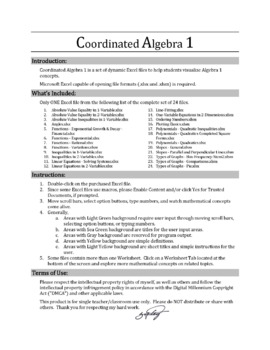
Demonstrate Graphing of Quadratics with an Animated Excel File
Simple to use animated Excel file for in class demonstration of graphing quadratic equations in standard form, completed square form, and factored form. Move scroll bars, select option buttons, type numbers, and watch these mathematical concepts come alive. You must use Microsoft Excel that is capable of opening file formats in either .xlsx or .xlsm.
Subjects:
Grades:
9th - 12th
Types:
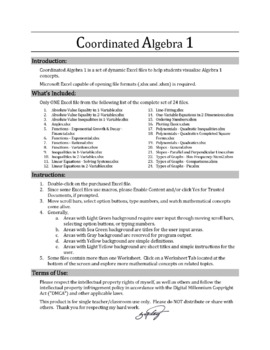
Demonstrate Graphing Quadratic Inequalities with an Animated Excel File
Simple to use animated Excel file for in class demonstration of graphing quadratic inequalities in standard form and completed square form with selectable inequality type and shading option. Move scroll bars, select option buttons, type numbers, and watch these mathematical concepts come alive. You must use Microsoft Excel that is capable of opening file formats in either .xlsx or .xlsm.
Subjects:
Grades:
9th - 12th
Types:
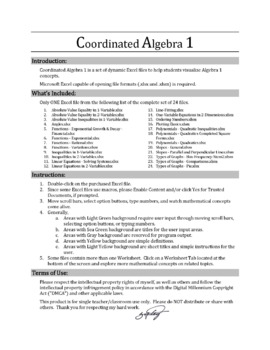
Demonstrate Inequalities in 1 Variable Graphs with an Animated Excel File
Simple to use animated Excel file for in class demonstration of Inequalities in 1 Variable graphs both simple and compound. Move scroll bars, select option buttons, type numbers, and watch these mathematical concepts come alive. You must use Microsoft Excel that is capable of opening file formats in either .xlsx or .xlsm.
Subjects:
Grades:
9th - 12th
Types:
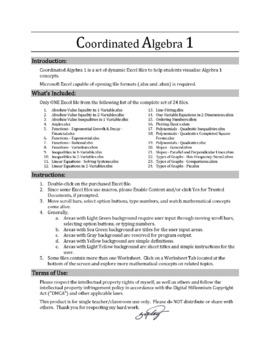
Demonstrate Graphs of Inequalities in 2 Variables with an Animated Excel File
Simple to use animated Excel file for in class demonstration of graphing Inequalities in 2 Variables. The first worksheet uses one equation in standard form. The second worksheet graphs systems of linear inequalities. Both worksheets allows selectable inequalities and shading. Move scroll bars, select option buttons, type numbers, and watch these mathematical concepts come alive. You must use Microsoft Excel that is capable of opening file formats in either .xlsx or .xlsm.
Subjects:
Grades:
9th - 12th
Types:
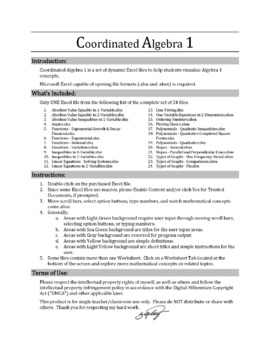
Demonstrate Direct and Inverse Variation Functions with an Animated Excel File
Simple to use animated Excel file for in class demonstration of direct and inverse variation function graphs. Move scroll bars, select option buttons, type numbers, and watch these mathematical concepts come alive. You must use Microsoft Excel that is capable of opening file formats in either .xlsx or .xlsm.
Subjects:
Grades:
9th - 12th
Types:
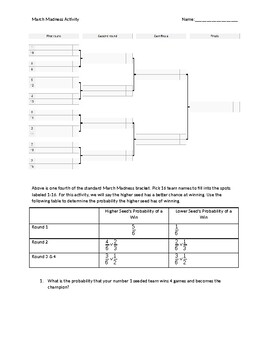
March "Math"ness Probability
I designed this activity to show how likely making a perfect bracket really is. It engages students in a fun probability activity where they can calculate a probability and also see probability in action. Students have to pick 16 teams (real or fictional) and determine who they think the winners will be in each game. After answering a few probability questions, they will use a die to determine the winners of each game. Then they will see if they would have won a bracket challenge.
Subjects:
Grades:
9th - 12th
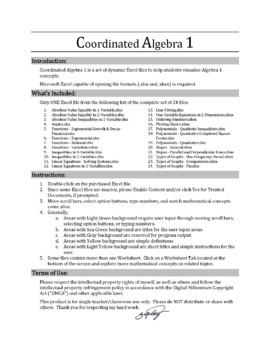
Demonstrate Rational Functions with an Animated Excel File
Simple to use animated Excel file for in class demonstration of rational function graphs. Move scroll bars, select option buttons, type numbers, and watch these mathematical concepts come alive. You must use Microsoft Excel that is capable of opening file formats in either .xlsx or .xlsm.
Subjects:
Grades:
9th - 12th
Types:
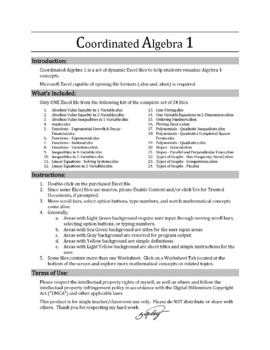
Demonstrate Exponential Growth & Decay with an Animated Excel File
Simple to use animated Excel file for in class demonstration of exponential growth and decay graphs with respect to finance. Move scroll bars, select option buttons, type numbers, and watch these mathematical concepts come alive. You must use Microsoft Excel that is capable of opening file formats in either .xlsx or .xlsm.
Subjects:
Grades:
9th - 12th
Types:
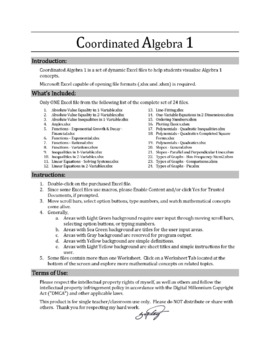
Demonstrate Solving Systems of Linear Equations with an Animated Excel File
Simple to use animated Excel file for in class demonstration of Solving Systems of Linear Equations using the graphing method. Move scroll bars, select option buttons, type numbers, and watch these mathematical concepts come alive. You must use Microsoft Excel that is capable of opening file formats in either .xlsx or .xlsm.
Subjects:
Grades:
9th - 12th
Types:
Showing 1-24 of 29 results


