4 results
Measurement projects on sale

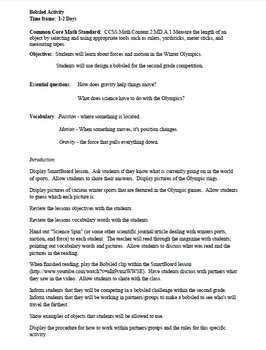
STEM Bobsled Olympic Lesson
Students are to work in groups or pairs and design a bobsled. Students will be provided with a toilet paper role, two popsicle sticks, two pipe cleaners, and 1 foot of masking tape. If students wish to brings small things from home, that is okay. Allow students to think through their design. Allow a trial run, and then allow modifications for improvement after the trail run. Hold a final event and display the gold, silver, and bronze winners for this event. This event is fun and engaging.
Subjects:
Grades:
1st - 8th
CCSS:

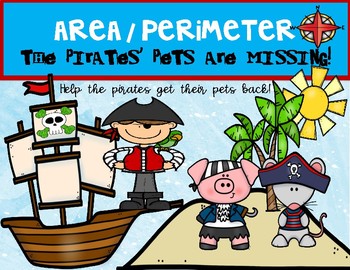
AREA AND PERIMETER ACTIVITIES / PROJECT/ WORKSHEETS AND TASK CARDS
WHO SAID AREA AND PERIMETER CAN NOT BE FUN?AREA / PERIMETER WORKSHEETS AND TASK CARDS BUNDLE!PIRATES THEME: THE RUNAWAY PETS!FUN! FUN! FUN!I created these quick, fun projects for my students to practice finding area and perimeter in a hands - on, fun way. We also used the graph paper to practice coloring and DECOMPOSING rectangles to find AREA.Included:28 TASK CARDS10 WORKSHEETS to practice finding area and perimeter20 animal cut outs20 additional cut outs to be used with the projects3 differe
Subjects:
Grades:
2nd - 4th
Types:

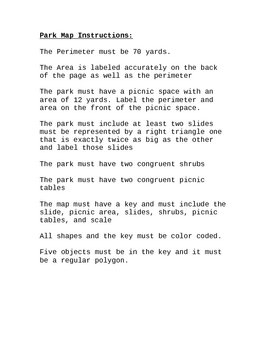
Park Map: Geometry Project (Distance Learning)
Area, Perimeter, Congruent, Similar, Regular Polygons...all incorporated into this geometry project.Students get the chance to use skills and knowledge of the above topics help create a map of a park.
Subjects:
Grades:
3rd - 6th
Types:

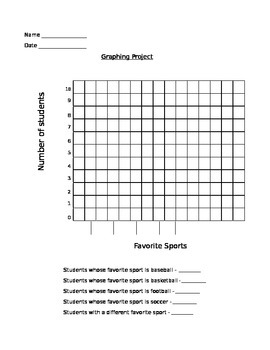
Graphing - Cooperative In-class Graphing Project
This worksheet is designed to help students improve their graphing abilities. They will first collect data from their classmates' favorite sports and create a bar graph based on the findings. On the other side, students will also collect data on their classmates' hair color and produce a bar graph. Both graphs will include information on the x-axis and y-axis, and students will fill in the corresponding bars.
Subjects:
Grades:
3rd - 6th
Types:
Showing 1-4 of 4 results


