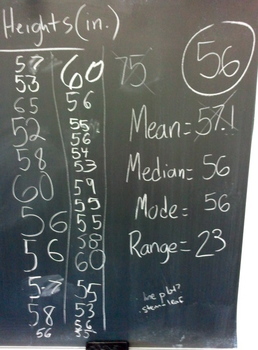
Introduction to Statistics (Focus on Mean, Median, Mode, & Range)
Eric Jayne
154 Followers
Grade Levels
3rd - 6th
Subjects
Resource Type
Standards
CCSS6.SP.B.5
Formats Included
- PPTX
Pages
11 pages
Eric Jayne
154 Followers
Description
I use this PowerPoint presentation to introduce (or in some cases review) our statistics unit. It starts off with a warm-up where students measure each other to capture some class data on height. Then the slides go through key vocabulary words, like mean, median, mode, range, outlier, data set, and cluster. Each of those slides provides a definition that students can take notes from and an example. At the end of the presentation, students are encouraged to apply these statistical measures to the classroom height data. One of the great things about using the heights is that you can also have the students stand in ascending height order so you can actually see the data. I do that after they've found the mean, median, and mode so that we can all see where in the data these numbers exist. That's fairly easy when the students are actually standing and representing the data. I also include my tall self in their data as a nice outlier.
This is intended to be viewed as a "show" since it contains some animation.
This is intended to be viewed as a "show" since it contains some animation.
Total Pages
11 pages
Answer Key
N/A
Teaching Duration
1 hour
Report this resource to TPT
Reported resources will be reviewed by our team. Report this resource to let us know if this resource violates TPT’s content guidelines.
Standards
to see state-specific standards (only available in the US).
CCSS6.SP.B.5
Summarize numerical data sets in relation to their context, such as by:


