53 results
5th grade Thanksgiving graphing lectures
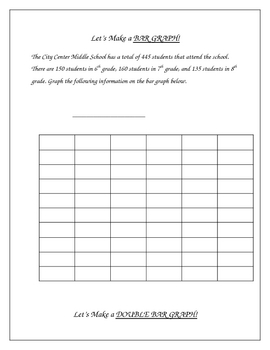
Constructing Graphs - Bar Graphs, Line Graphs, Circle Graphs
**I revised the numbers in the pie graph on this from the first version, these amounts are much more friendly** This activity includes construction of a bar graph, double bar graph, line graph, double line graph, and a circle graph.I put this together after being frustrated about not being able to find any graphing activities appropriate for intermediate grades that would allow me to make graphs with the class on my smartboard. I needed some examples to demonstrate how to take data and create a
Subjects:
Grades:
3rd - 10th, Adult Education
Types:

Noah's Ark and My Family | Curriculum | Bible Lessons | Biblical studies
A 7-Lesson Family Bible Study"These commandments that I give you today are to be on your hearts. Impress them on your children. Talk about them when you sit at home and when you walk along the road, when you lie down and when you get up. Tie them as symbols on your hands and bind them on your foreheads. Write them on the doorframes of your houses and on your gates.” DEUTERONOMY 6:6-9This 7-Lesson Family Bible study will help you focus on YOUR family, and their salvation, while also helping to t
Subjects:
Grades:
PreK - 12th, Higher Education, Adult Education, Staff
Types:
Histograms and Frequency Tables (Powerpoint) for Busy Teachers
This powerpoint presentation introduces the concept of histograms and frequency tables.
Clipart, sounds, and animation are used sparingly and effectively to help illustrate points without being distracting. This powerpoint presentation has been extensively refined using faculty AND student input and feedback.
Definitions of histogram, interval, frequency table, and frequency are all presented. The progression from a frequency table to a completed histogram is illustrated and animated using
Subjects:
Grades:
4th - 12th, Higher Education, Adult Education
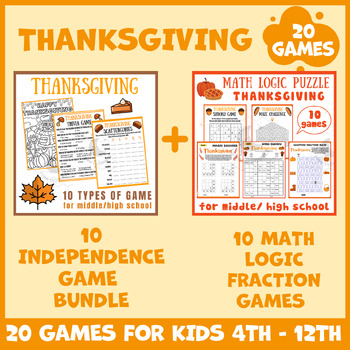
Thanksgiving BUNDLE math puzzle worksheets icebreaker game brain breaks no prep
The Thanksgiving puzzle is a combination of Mental math and independence game activity, Critical thinking, problem solving, brain breaks, crafts, phonics, main idea, centers, activity NO PREP, substitute, Classroom Management, gift idea, Place value, and logic games with solutions. Place value, Numbers, Math test prep, and Other Math activities. This game is great for ages: 4th 5th 6th 7th 8th 9th 10th 11th 12th grade, Kid Education, early finishers, homeschool, Nursery school, Junior high schoo
Subjects:
Grades:
5th - 12th
Types:
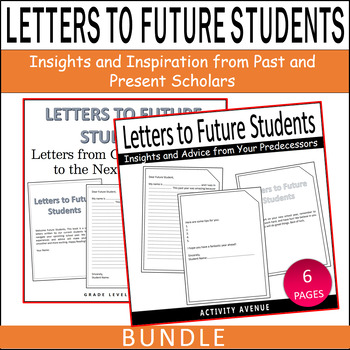
Letters to Future Students: Insights and Inspiration from Past and Present Schol
Delve into a dual narrative of wisdom and camaraderie with "Letters to Future Students: Insights and Inspiration from Past and Present Scholars." This comprehensive package brings together two invaluable volumes, each offering a unique perspective on the student experience.Book 1: Letters to Future Students: Insights and Advice from Your Predecessors Gain insights from those who have tread the academic path before you in "Letters to Future Students: Insights and Advice from Your Predecessors." T
Subjects:
Grades:
1st - 8th
Types:
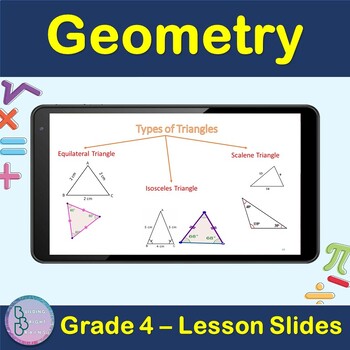
Geometry | 4th Grade PowerPoint Lesson Slides Line Circle polygon Triangle
Are you teaching your students about Geometry For 4th Grade? Plenty of examples and application exercises are included. You can also easily convert this to a Google Slides lesson by dragging it into your Google Drive.What is included?✦ 49 total slides for notes, examples and applications.✦ All steps are animated to allow the teacher to explain them gradually. At the end of the lesson, students will be able to Apply✦ Point, Line, Line segment✦ Angles, Parallel and perpendicular lines✦ Circles✦ po
Grades:
3rd - 5th

Notes - Introduction to Inequalities
These are notes used to introduce students to inequalities. Students will represent inequalities graphically (on a number line), translate an inequality in words to an inequality using symbols and graph, state whether a number is in the solution set of an inequality and write and graph inequalities that represent real-life situations.
Grades:
5th - 8th
Types:
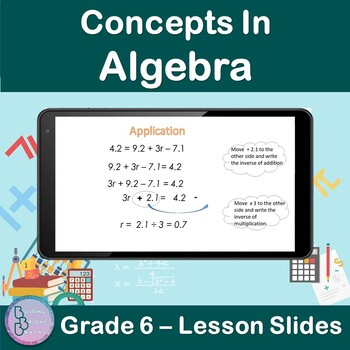
Concepts in Algebra | 6th Grade PowerPoint Lesson Slides | Algebraic Patterns
Are you teaching your students about Concepts In Algebra For 6th Grade? Plenty of examples and application exercises are included. You can also easily convert this to a Google Slides lesson by dragging it into your Google Drive.What is included?✦ 47 total slides for notes, examples and applications.✦ All steps are animated to allow the teacher to explain them gradually. At the end of the lesson, students will be able to✦ Solve Algebraic Patterns ✦ Solve Two-Step Equations✦ Solve Addition and Sub
Grades:
5th - 7th
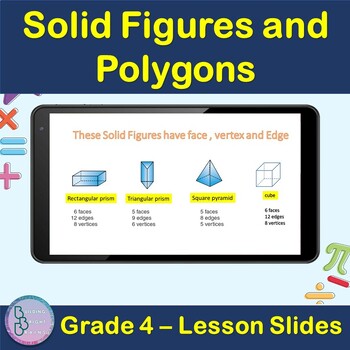
Solid Figures and Polygons | 4th Grade PowerPoint Lesson Slides
Are you teaching your students about Solid Figures and Polygons For 4th Grade? Plenty of examples and application exercises are included. You can also easily convert this to a Google Slides lesson by dragging it into your Google Drive.What is included?✦ 11 total slides for notes, examples and applications.✦ All steps are animated to allow the teacher to explain them gradually. At the end of the lesson, students will be able to ✦ Define Polygons✦ Define Solid figures✦ Understand Solid figures Fac
Grades:
3rd - 5th

Caddo and Karankawa Tribes
Caddo and Karankawa Indians of the Coastal Plains.
Grades:
2nd - 6th, Not Grade Specific

The True Story of Thanksgiving (Wampanoag and Patuxet Perspectives)
In these slides, students will learn a brief version of the true story of Thanksgiving from the perspectives of the Indigenous peoples involved. After much research, I have consolidated my findings into a story format that most elementary students can follow and process, while still acknowledging the violence and difficult aspects of this story. This slide deck would be a great starting point to give students background information on why Thanksgiving is celebrated in the United States, and can
Grades:
3rd - 6th
Data Representation Powerpoint
The presentation contains: 1) TALLY MARKS Learning Objectives. Definition of a tally mark. Uses of tally mark. How to count a tally mark. Tally Mark Chart. Construction of a tally mark table with an example. Application on real life problems on tally mark. Read and Interpret a tally mark table.The presentation contains: 2) FREQUENCY DISTRIBUTION TABLEDefinition of a Frequency Distribution Table. Types of Frequency Distribution Table: a) Discrete Frequency Distribution Table (Ungrouped).b) C
Subjects:
Grades:
1st - 10th, Higher Education, Staff
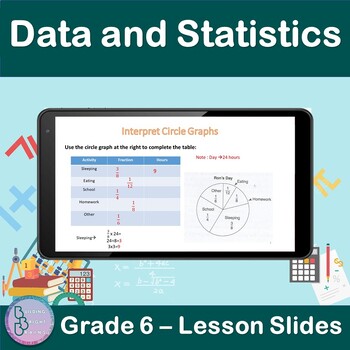
Data and Statistics | 6th Grade PowerPoint Lesson Slides | Circle Graphs
Are you teaching your students about Data and Statistics For 6th Grade? Plenty of examples and application exercises are included. You can also easily convert this to a Google Slides lesson by dragging it into your Google Drive.What is included?✦ 9 total slides for notes, examples and applications.✦ All steps are animated to allow the teacher to explain them gradually. At the end of the lesson, students will be able to✦ Interpret Circle Graphs.✦ Use a circle graph to complete s table.✦ Use a cir
Subjects:
Grades:
5th - 7th
The First Thanksgiving PowerPoint
An informative powerpoint about the history behind the first Thanksgiving
Includes: Primary source photos of the Mayflower II in Plymouth (with labels), external links to relevant sites/materials, maps, and diagrams.
Used as an excellent aide to a lecture about the first Thanksgiving, providing students with factual information and history
Can be used as an aide to a DBQ (I used it to accompany a Columbus DBQ to compare/contrast American history.)
(28 slides)
Subjects:
Grades:
4th - 8th
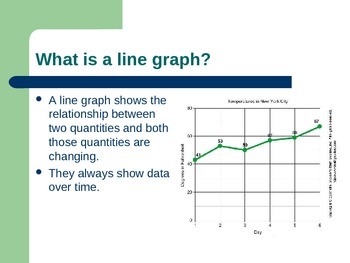
Graphing Powerpoint
This is an introductory PowerPoint graphing. The PowerPoint includes:
-Different types of graphs
-Vocabulary used to construct a graph
-How to construct a line graph
Notes of formatted is such a way that they can easily be used in A.V.I.D. Cornell Note style with the heading being used as the question in the left column and the notes for the right column.
Subjects:
Grades:
5th - 7th
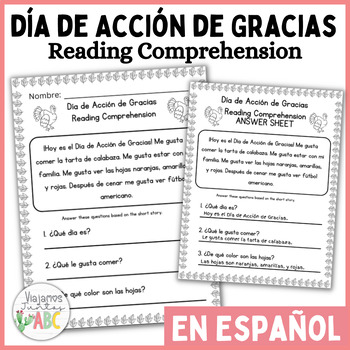
Día de Acción de Gracias - Thanksgiving Reading Comprehension in Spanish
Día de Acción de Gracias - Thanksgiving Reading Comprehension in Spanishis great for practice and reinforce your kids' understanding of the "gustar" verb in context.This product features a Thanksgiving themed short story in Spanish along with three corresponding comprehension questions. The second page includes the answers. It's an ideal resource for Spanish language learners looking to improve their reading and comprehension skills while exploring the vocabulary of Thanksgiving and the verb 'Gu
Subjects:
Grades:
K - 6th
Types:
Also included in: BUNDLE - Día de Acción de Gracias Thanksgiving Activities in Spanish
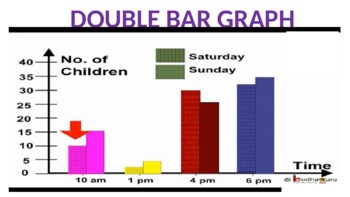
Double Bar Graph Powerpoint
The presentation contains:Learning Objectives.Definition of a double bar graph.Parts of a double bar graph.Difference between bar graph and double bar graph.Tips for construction of double bar graph.Steps to construct double bar graph with an example.To read and interpret the double bar graph.
Subjects:
Grades:
5th - 10th, Staff
Also included in: Data Representation Powerpoint
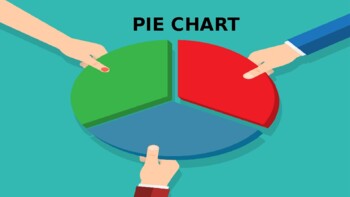
Pie Chart Powerpoint
The presentation contains:Learning Objectives.Definition of a Pie Chart.Tips for construction of pie chart.Steps to construct a pie chart with an example.Scaling and drawing a pie chart.Read and Interpret a pie chart.
Subjects:
Grades:
5th - 10th, Staff
Also included in: Data Representation Powerpoint
The History of Thanksgiving - PowerPoint Presentation
This is a 35-slide PowerPoint presentation for you to teach your class about the history and traditions associated with Thanksgiving. There are note guides included for students to stay engaged and follow along. You can use this PowerPoint to teach your class about the history of Thanksgiving as part of a larger study of the colonial era of the United States, or just as a fun look at how we came to celebrate this holiday. The PowerPoint is made with an attractive arrangement of colors and pictur
Grades:
5th - 12th
Also included in: History of Halloween & Thanksgiving PowerPoints - PAIR PACK
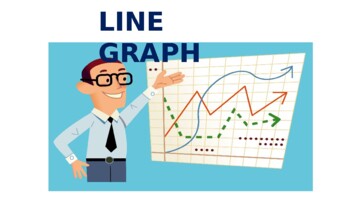
Line Graph Powerpoint
The presentation contains:Learning objectives.Definition of a line graph.Parts of a line graph.Tips for construction of line graph.Steps to construct line graph with an example.Reading and Interpreting a line graph.Advantage of line graph.
Subjects:
Grades:
5th - 10th, Staff
Also included in: Data Representation Powerpoint
Susquehannock Indians Google slide presentation/report
Short 8 page presentation on the Susquehannock Indians who lived in Pennsylvania. Lifestyle, artifacts and basic facts. Perfect addition to your study of the Native American tribes in the Northeast in the 1600's.
Grades:
4th - 12th
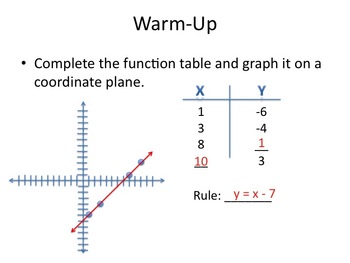
Graphing Linear Equations (focus on Real-Life Situations)
This PowerPoint can be used to introduce students to graphing linear equations. It should be played as a slideshow, where it steps students through linear equations by starting with the basic idea of graphing a function. The presentation ramps up to focusing on real-life situations that might be represented by a function. The show ends by looking at different graphs and asking students to think of a real-world situation that might match the given graph.
Grades:
5th - 8th
CCSS:
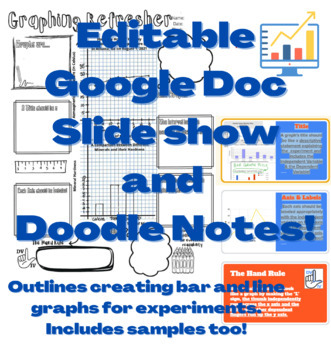
Scientific Graphing EDITABLE Google Slide Show with Keys and Doodle Note Sheet
This Slide Show does a wonderful job outlining key aspects of graphs including: Line and bar graphs, accurate titling, axis, and scaling. The doodle note sheet gives two examples of correct graphs, in addition to encouraging students creativity. It will help your students create their own graphs to represent their data in future experiments from start to finish.
Grades:
5th - 9th
Types:
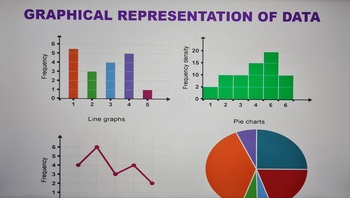
Graphical Representation of Data Powerpoint
The presentation contains the follows:1) BAR GRAPH Learning objectives. Definition of a bar graph. Parts of a bar graph. Tips for construction of bar graph. Steps to construct bar graph with an example. Types of bar graph. Advantages of bar graph. 2) DOUBLE BAR GRAPH Learning Objectives. Definition of a double bar graph. Parts of a double bar graph. Difference between bar graph and double bar graph. Tips for construction of double bar graph. Steps to construct double bar graph wit
Subjects:
Grades:
5th - 9th, Staff
Showing 1-24 of 53 results


