55 results
5th grade Thanksgiving statistics lectures
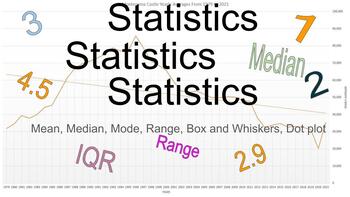
Statistics Unit
Fun with Box and Whiskers, Mean, Median, Mode, Range, Five Number Summary using anything from McDonald's food to M&M's with SKittles.

Noah's Ark and My Family | Curriculum | Bible Lessons | Biblical studies
A 7-Lesson Family Bible Study"These commandments that I give you today are to be on your hearts. Impress them on your children. Talk about them when you sit at home and when you walk along the road, when you lie down and when you get up. Tie them as symbols on your hands and bind them on your foreheads. Write them on the doorframes of your houses and on your gates.” DEUTERONOMY 6:6-9This 7-Lesson Family Bible study will help you focus on YOUR family, and their salvation, while also helping to t
Subjects:
Grades:
PreK - 12th, Higher Education, Adult Education, Staff
Types:
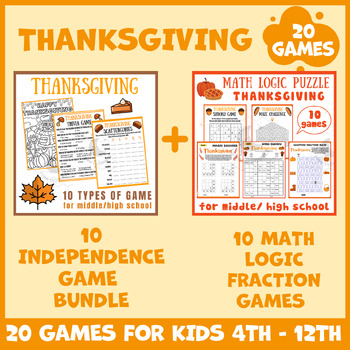
Thanksgiving BUNDLE math puzzle worksheets icebreaker game brain breaks no prep
The Thanksgiving puzzle is a combination of Mental math and independence game activity, Critical thinking, problem solving, brain breaks, crafts, phonics, main idea, centers, activity NO PREP, substitute, Classroom Management, gift idea, Place value, and logic games with solutions. Place value, Numbers, Math test prep, and Other Math activities. This game is great for ages: 4th 5th 6th 7th 8th 9th 10th 11th 12th grade, Kid Education, early finishers, homeschool, Nursery school, Junior high schoo
Subjects:
Grades:
5th - 12th
Types:
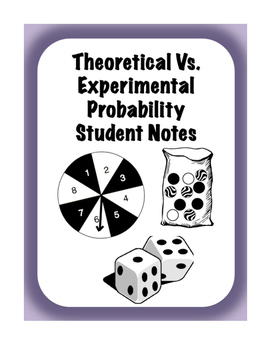
Theoretical vs Experimental Probability Interactive Scaffolded/Guided Notes
These notes provide a clear explanation of theoretical and experimental probability with examples involving spinners, die, and marbles. Students will also get extra practice converting their probabilities to decimals, fractions, and percents along with predicting the probability of an event happening.
There is also a flipped classroom video that goes along with these notes that can be accessed at-
https://youtu.be/FAHvmiYJA1A
Subjects:
Grades:
5th - 8th

Changing the Face of Math Education Book 2
Whether you are a teacher, a parent, a student, strong in math or weak in math, the material in this book will change the way you view and compute math in the future. Be ready to be amazed and intrigued as you go through the book by all the information you probably were never exposed to in your math education. This book will answer many questions you may have had in the past while giving you a much stronger conceptual understanding of math. This book will expose you to many different problem-sol
Subjects:
Grades:
4th - 12th
Types:
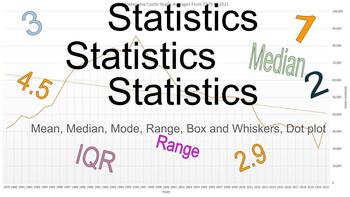
Statistics (Mean, Median, Mode, Box and Whiskers, with the five number summary
Teaching statistics to 6th graders can be an engaging experience by making the concepts relatable and visual. Five-Number SummaryThe five-number summary includes the minimum, first quartile, median, third quartile, and maximum. These values help summarize a set of data and are used in creating box plots. Start by having students collect a small dataset, such as their test scores, and calculate these five points to see how data is distributed.Box and Whisker PlotsA box and whisker plot (box plot)
Subjects:
Grades:
5th - 7th
Types:
Also included in: Statistics Unit

Caddo and Karankawa Tribes
Caddo and Karankawa Indians of the Coastal Plains.
Grades:
2nd - 6th, Not Grade Specific
The True Story of Thanksgiving (Wampanoag and Patuxet Perspectives)
In these slides, students will learn a brief version of the true story of Thanksgiving from the perspectives of the Indigenous peoples involved. After much research, I have consolidated my findings into a story format that most elementary students can follow and process, while still acknowledging the violence and difficult aspects of this story. This slide deck would be a great starting point to give students background information on why Thanksgiving is celebrated in the United States, and can
Grades:
3rd - 6th
Data Representation Powerpoint
The presentation contains: 1) TALLY MARKS Learning Objectives. Definition of a tally mark. Uses of tally mark. How to count a tally mark. Tally Mark Chart. Construction of a tally mark table with an example. Application on real life problems on tally mark. Read and Interpret a tally mark table.The presentation contains: 2) FREQUENCY DISTRIBUTION TABLEDefinition of a Frequency Distribution Table. Types of Frequency Distribution Table: a) Discrete Frequency Distribution Table (Ungrouped).b) C
Subjects:
Grades:
1st - 10th, Higher Education, Staff
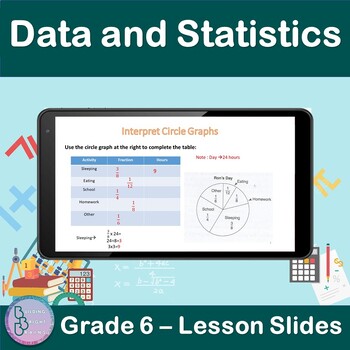
Data and Statistics | 6th Grade PowerPoint Lesson Slides | Circle Graphs
Are you teaching your students about Data and Statistics For 6th Grade? Plenty of examples and application exercises are included. You can also easily convert this to a Google Slides lesson by dragging it into your Google Drive.What is included?✦ 9 total slides for notes, examples and applications.✦ All steps are animated to allow the teacher to explain them gradually. At the end of the lesson, students will be able to✦ Interpret Circle Graphs.✦ Use a circle graph to complete s table.✦ Use a cir
Subjects:
Grades:
5th - 7th
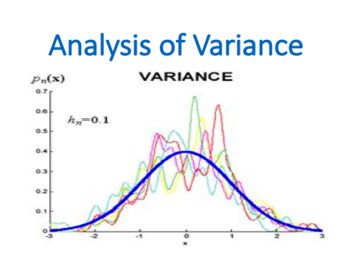
Analysis of Variance (ANOVA) (Statistics)
Analysis of Variance (ANOVA) is a lecture which is covered within the Statistic or Basic Business Statistic module by business and economics students.Analysis of variance, known by the acronym ANOVA, allows statistical comparison among samples taken from many populations. While ANOVA literally does analyze variation, the purpose of ANOVA is to reach conclusions about possible differences among the means of each group, analogous to the hypothesis tests of the previous chapter. Every ANOVA design
Subjects:
Grades:
5th - 12th, Higher Education, Adult Education, Staff
Types:
Also included in: Statistics Module Bundle
A Roadmap for Analyzing Data (Statistics)
A Roadmap for Analyzing Data is a lecture which is covered within the Statistic or Basic Business Statistic module by business and economics students. Choosing appropriate statistical methods for your data is the single most important task you face and is at the heart of “doing statistics.” But this selection process is also the single most difficult thing you do when applying statistics! How, then, can you ensure that you have made an appropriate choice? By asking a series of questions, you can
Subjects:
Grades:
5th - 12th, Higher Education, Adult Education, Staff
Also included in: Statistics Module Bundle
The First Thanksgiving PowerPoint
An informative powerpoint about the history behind the first Thanksgiving
Includes: Primary source photos of the Mayflower II in Plymouth (with labels), external links to relevant sites/materials, maps, and diagrams.
Used as an excellent aide to a lecture about the first Thanksgiving, providing students with factual information and history
Can be used as an aide to a DBQ (I used it to accompany a Columbus DBQ to compare/contrast American history.)
(28 slides)
Subjects:
Grades:
4th - 8th
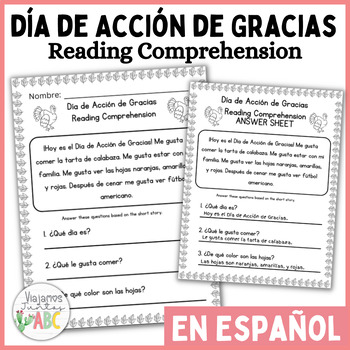
Día de Acción de Gracias - Thanksgiving Reading Comprehension in Spanish
Día de Acción de Gracias - Thanksgiving Reading Comprehension in Spanishis great for practice and reinforce your kids' understanding of the "gustar" verb in context.This product features a Thanksgiving themed short story in Spanish along with three corresponding comprehension questions. The second page includes the answers. It's an ideal resource for Spanish language learners looking to improve their reading and comprehension skills while exploring the vocabulary of Thanksgiving and the verb 'Gu
Subjects:
Grades:
K - 6th
Types:
Also included in: BUNDLE - Día de Acción de Gracias Thanksgiving Activities in Spanish
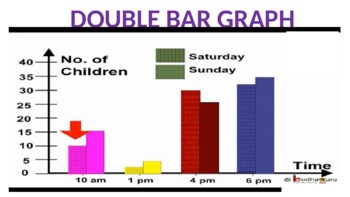
Double Bar Graph Powerpoint
The presentation contains:Learning Objectives.Definition of a double bar graph.Parts of a double bar graph.Difference between bar graph and double bar graph.Tips for construction of double bar graph.Steps to construct double bar graph with an example.To read and interpret the double bar graph.
Subjects:
Grades:
5th - 10th, Staff
Also included in: Data Representation Powerpoint
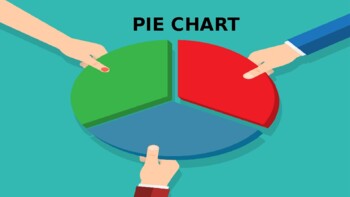
Pie Chart Powerpoint
The presentation contains:Learning Objectives.Definition of a Pie Chart.Tips for construction of pie chart.Steps to construct a pie chart with an example.Scaling and drawing a pie chart.Read and Interpret a pie chart.
Subjects:
Grades:
5th - 10th, Staff
Also included in: Data Representation Powerpoint
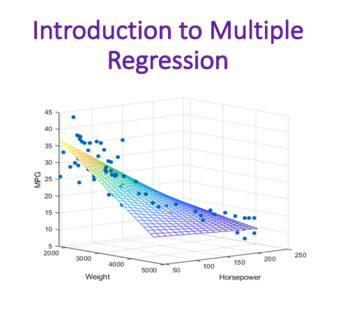
Introduction to Multiple Regression (Statistics)
Introduction to Multiple Regression is a lecture which is covered within the Statistic or Basic Business Statistic module by business and economics students.This lecture will introduce you to multiple regression models that use two or more independent variables to predict the value of a dependent variable. Learning objectives: · How to develop a multiple regression model· How to interpret the regression coefficients· How to determine which independent variables to include in the regression mode
Subjects:
Grades:
5th - 12th, Higher Education, Adult Education, Staff
Types:
Also included in: Statistics Module Bundle
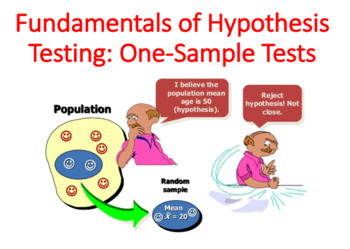
Fundamentals of Hypothesis Testing: One-Sample Tests
Fundamentals of Hypothesis Testing: One-Sample Tests is a lecture which is covered within the Statistic or Basic Business Statistic module by business and economics students. In this lecture, you will learn several applications of hypothesis testing. You will learn how to make inferences about a population parameter by analyzing differences between the results observed, the sample statistic, and many more. Learning objectives: The basic principles of hypothesis testingHow to use hypothesis testi
Subjects:
Grades:
5th - 12th, Higher Education, Adult Education, Staff
Types:
Also included in: Statistics Module Bundle
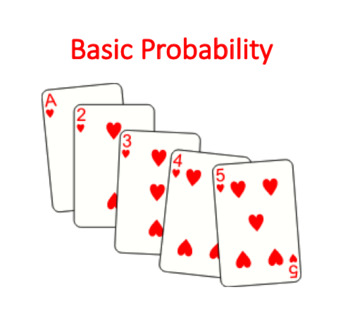
Basic Probability (Statistics)
Basic Probability is a lecture which is covered within the Statistic or Basic Business Statistic module by business and economics students.The principles of probability help bridge the worlds of descriptive statistics and inferentialstatistics. Probability principles are the foundation for the probability distribution, the concept of mathematical expectation, and the binomial, Poisson, and hypergeometric distributions, topics. In this lecture you learn to: Basic probability conceptsAbout conditi
Subjects:
Grades:
5th - 12th, Higher Education, Adult Education, Staff
Types:
Also included in: Statistics Module Bundle
The History of Thanksgiving - PowerPoint Presentation
This is a 35-slide PowerPoint presentation for you to teach your class about the history and traditions associated with Thanksgiving. There are note guides included for students to stay engaged and follow along. You can use this PowerPoint to teach your class about the history of Thanksgiving as part of a larger study of the colonial era of the United States, or just as a fun look at how we came to celebrate this holiday. The PowerPoint is made with an attractive arrangement of colors and pictur
Grades:
5th - 12th
Also included in: History of Halloween & Thanksgiving PowerPoints - PAIR PACK
Introduction to Statistics (Focus on Mean, Median, Mode, & Range)
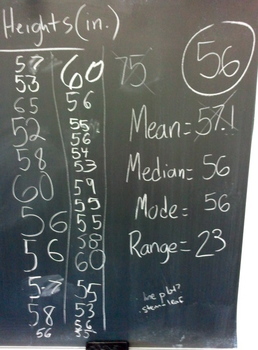
I use this PowerPoint presentation to introduce (or in some cases review) our statistics unit. It starts off with a warm-up where students measure each other to capture some class data on height. Then the slides go through key vocabulary words, like mean, median, mode, range, outlier, data set, and cluster. Each of those slides provides a definition that students can take notes from and an example. At the end of the presentation, students are encouraged to apply these statistical measures to
Subjects:
Grades:
3rd - 6th
CCSS:
Line Graph Powerpoint
The presentation contains:Learning objectives.Definition of a line graph.Parts of a line graph.Tips for construction of line graph.Steps to construct line graph with an example.Reading and Interpreting a line graph.Advantage of line graph.
Subjects:
Grades:
5th - 10th, Staff
Also included in: Data Representation Powerpoint
Time-Series Forecasting (Statistics)
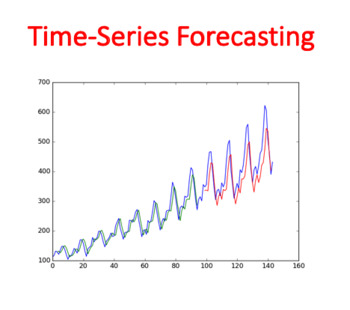
Time-Series Forecasting is a lecture which is covered within the Statistic or Basic Business Statistic module by business and economics students. A time series is a set of numerical data collected over time. Due to differences in the features of data for various investments described in the Using Statistics scenario, you need to consider several different approaches for forecasting time-series data. This lecture begins with an introduction to the importance of business forecasting and a descript
Subjects:
Grades:
5th - 12th, Higher Education, Adult Education, Staff
Also included in: Statistics Module Bundle
Susquehannock Indians Google slide presentation/report
Short 8 page presentation on the Susquehannock Indians who lived in Pennsylvania. Lifestyle, artifacts and basic facts. Perfect addition to your study of the Native American tribes in the Northeast in the 1600's.
Grades:
4th - 12th
Showing 1-24 of 55 results


