3 results
Graphing research for staff

6 Editable Bar Graph Templates 2.0
Finally a simple and professional graph space that students can fill out without any design issues getting in the way. This file contains 6 ready-to-use graph options. Print them and have students fill them with pencil and ruler, or distribute them over computer and let them practice entering the data. Get a project perfect finish every time. Maybe you just want to fill it out live on a projector? The possibilities are endless! It's okay to say you love these bar graphs. So do we.Contains:- 2 bl

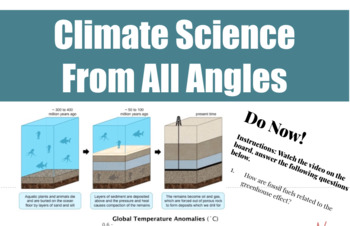
Climate Science From All Angles
Great for remote instruction! Bring your Earth science students' active knowledge of climate to a whole new level with multi-modal activities in "Climate Science from All Angles." These sequenced approaches to building scientific-literacy incorporate current news, graphing, argumentation, and scaffolded methods for writing scientific explanations. Where Science and Literacy Meet! learnmore@stemjourneys.org.
Subjects:
Grades:
5th - 12th, Higher Education, Adult Education, Staff, Not Grade Specific
Types:
CCSS:
NGSS:
MS-ESS3-2
, MS-ESS3-5
, MS-ESS3-3

THE BOOK OF NUMBERS: A MATH/ BIBLICAL RESEARCH/CHARTING PROJECT; GRS. 4-8
This is a six page research/math project based on the Book of Numbers in the Hebrew Scriptures. It entails rounding off, and graphing populations of the Tribes of Israel. It has interesting tidbits and symbols built in, with some research/response questions. The gemology symbols, and math populations helps to build a better picture of the ancient world, and how marvelous it was! Graphing is fun, too. Thanks ever so much for vising and supporting our shop.
Showing 1-3 of 3 results


