5 results
Other (math) research for staff
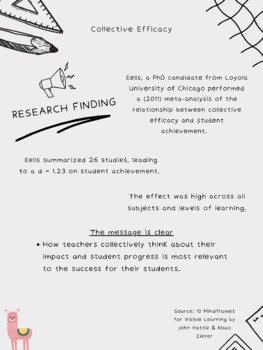
Research Findings Posters | Six | Visible Learning by John Hattie & Klaus Zierer
Using John Hattie's new book 10 Mindframes for Visible Learning we created 6 posters. These 6 posters provide important reminders about the things that truly impact Student Achievement.
Subjects:
Grades:
Staff

Math can be FUN!
This project allows students to choose their own topic, something they truly enjoy and love, and turn it into a math project! The students choose three things they love and the teacher makes the final pick. Once chosen, students then look for sources on the "mathematics" of their topic and away they go! Students REALLY LOVE doing this project and you will be amazed at what they find!!! This assignment includes a Rubric for Grading, and two links to the Directions/Introduction to the project as a
Subjects:
Grades:
6th - 10th, Staff
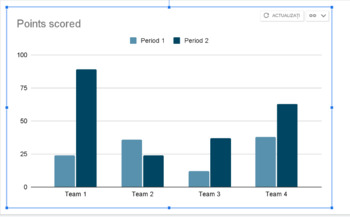
Editable Double Column Chart Diagram for Digital Learning - Google Slide
With this Editable Double Column Chart Diagram for Digital Learning you can easily prepare your column chart diagram presentations and you can use them in almost any activity. Be creative!Useful for any teacher that wants to explain and demonstrate what is a column chart diagram, why and when people are using it. Column chart Diagrams help you and your students visualize the results, read diagram charts, etc.This is an editable Column Chart Diagram. You will get 1 Google Spreadsheet File and 1 G
Subjects:
Grades:
1st - 12th, Higher Education, Adult Education, Staff
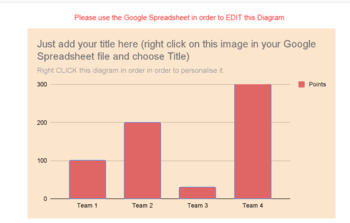
Editable Chart Diagram - One Column - for Digital Learning - Google Slide
With this Editable One Column Chart Diagram for Digital Learning you can easily prepare your column chart diagram presentations and you can use them in almost any activity. Be creative!Useful for any teacher that wants to explain and demonstrate what is a column chart diagram, why and when people are using it.Column chart Diagrams help you and your students visualize the results, read diagram charts, etc. Very helpful for math activities and statistics.This is an editable Column Chart Diagram. Y
Subjects:
Grades:
1st - 12th, Higher Education, Adult Education, Staff
Types:
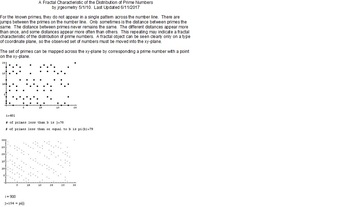
A Fractal Characteristic of the Distribution of Prime Numbers
A resource for realizing the fractal characteristic of the distribution of the set of Prime Numbers. The set of prime numbers undergoes 2-D maps from the number line to Quadrant I of the xy-plane. A Line-graph relation is generated through the mapped primes numbers. The fractal characteristic of the relation is developed and verified. Graphs of the patterns of the relation for increasingly larger subsets of the prime numbers are presented, visualizing the fractalness of the relation. The re
Subjects:
Grades:
11th - 12th, Higher Education, Staff
Types:
Showing 1-5 of 5 results


