24 results
Graphing lectures for staff

Data Representation Powerpoint
The presentation contains: 1) TALLY MARKS Learning Objectives. Definition of a tally mark. Uses of tally mark. How to count a tally mark. Tally Mark Chart. Construction of a tally mark table with an example. Application on real life problems on tally mark. Read and Interpret a tally mark table.The presentation contains: 2) FREQUENCY DISTRIBUTION TABLEDefinition of a Frequency Distribution Table. Types of Frequency Distribution Table: a) Discrete Frequency Distribution Table (Ungrouped).b) C
Subjects:
Grades:
1st - 10th, Higher Education, Staff

Pie Chart Powerpoint
The presentation contains:Learning Objectives.Definition of a Pie Chart.Tips for construction of pie chart.Steps to construct a pie chart with an example.Scaling and drawing a pie chart.Read and Interpret a pie chart.
Subjects:
Grades:
5th - 10th, Staff
Also included in: Data Representation Powerpoint
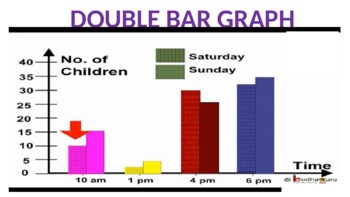
Double Bar Graph Powerpoint
The presentation contains:Learning Objectives.Definition of a double bar graph.Parts of a double bar graph.Difference between bar graph and double bar graph.Tips for construction of double bar graph.Steps to construct double bar graph with an example.To read and interpret the double bar graph.
Subjects:
Grades:
5th - 10th, Staff
Also included in: Data Representation Powerpoint
Grade 12 Data Management MDM4U Statistics Math Assessments & Exam package
There is at least 1+ test for each topic. An exam is attached as well. The assessments and exam fall on the following topics:Statistics of One VariableStatistics of Two VariablesPermutationCombinationProbabilityProbability DistributionsNormal Distribution__________________________________________________________________Contact me at MiriamsMath@gmail.com if you experience any issues. Please give me a chance to fix it before leaving a review. I always love having happy customers._________________
Subjects:
Grades:
10th - 12th, Higher Education, Staff
Types:

Introduction to Data Visualization
This presentation introduces key concepts and considerations in data visualization, including:the history of data visualizationan introduction to the benefits and importance of data visualization types of visualizationshow to choose a visualization typedata visualization design principles and best practicesleading data visualization platforms the differences between raster and vector graphicskey considerations when thinking about creating a visualization Use this as part of a unit on graphing, d
Subjects:
Grades:
6th - 12th, Higher Education, Adult Education, Staff
Also included in: Graphic Design Growing Bundle
Line Graph Powerpoint
The presentation contains:Learning objectives.Definition of a line graph.Parts of a line graph.Tips for construction of line graph.Steps to construct line graph with an example.Reading and Interpreting a line graph.Advantage of line graph.
Subjects:
Grades:
5th - 10th, Staff
Also included in: Data Representation Powerpoint
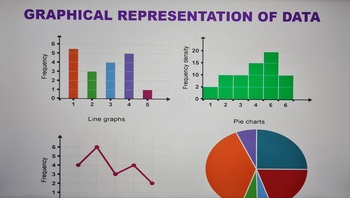
Graphical Representation of Data Powerpoint
The presentation contains the follows:1) BAR GRAPH Learning objectives. Definition of a bar graph. Parts of a bar graph. Tips for construction of bar graph. Steps to construct bar graph with an example. Types of bar graph. Advantages of bar graph. 2) DOUBLE BAR GRAPH Learning Objectives. Definition of a double bar graph. Parts of a double bar graph. Difference between bar graph and double bar graph. Tips for construction of double bar graph. Steps to construct double bar graph wit
Subjects:
Grades:
5th - 9th, Staff
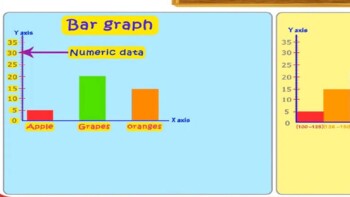
Bar Graph Powerpoint
The presentation contains:Learning objectives.Definition of a bar graph.Parts of a bar graph.Tips for construction of bar graph.Steps to construct bar graph with an example.Types of bar graph.Advantages of bar graph.
Subjects:
Grades:
6th - 9th, Higher Education, Staff
Also included in: Data Representation Powerpoint
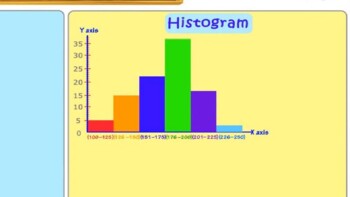
Histogram Powerpoint
The presentation contains:Learning Objectives.Definition of a Histogram.Parts of a histogram.Difference Between bar graph and histogram.Types of intervals.Tips for construction of bar graph.Steps to construct bar graph with an example.Read and Interpret a histogram.
Subjects:
Grades:
7th - 11th, Staff
Also included in: Data Representation Powerpoint

GRAPH PAPER NOTEBOOK
GRAPH PAPER NOTEBOOK 2022This paper book is a 102-page graph paper notebook consisting of pretty little square sheets in plain light blue, paper size 8.5 x 11 inches, 21.59 x 27.94 cm.★ ★This paperbook has several characteristics, including:· Plenty of space for writing or drawing· Font color is light blue· The size of the book is medium and suitable for different users and in different fields.· Pptx file containing lines and frame with transparent backgrounds that can be modified· JPG size 8.5
Subjects:
Grades:
7th - 12th, Higher Education, Adult Education, Staff
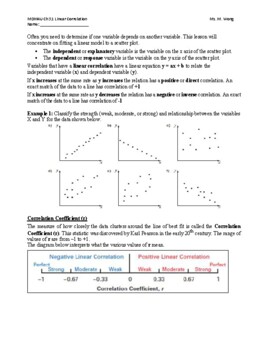
Grade 12 Data Management MDM4U Math Ch3 Statistics of Two Variables
The lesson notes provide learning goals for each subtopic which I find quite useful to students. I usually demonstrate an example to students and then let them work on similar questions. We will then take up the questions in class. There are answers to some questions. The product includes lesson notes and practices on the following topics:CorrelationsLeast Square MethodLinear RegressionCause and effect__________________________________________________________________Contact me at MiriamsMath@gm
Subjects:
Grades:
10th - 12th, Higher Education, Staff
Types:
Introduction to Graphs Powerpoint
The presentation contains:Real life application.Mathematician behind the Cartesian system .Ordered pair with examples.Coordinate Planes.Quadrants.The signs of each of the Quadrant with examples.Way of locating points on a graph paper.
Subjects:
Grades:
7th - 10th, Staff
Frequency Distribution Table Powerpoint
Objective: The student will be able to organize the given data to a meaningful and understandable.The presentation contains:Definition of a Frequency Distribution Table. Types of Frequency Distribution Table: a) Discrete Frequency Distribution Table (Ungrouped).b) Continuous Frequency Distribution Table (Grouped). Uses of Frequency Distribution Data.5 steps to construct a Frequency Distribution Table with one example on ungrouped data and two examples on grouped data.Steps include how to
Subjects:
Grades:
5th - 8th, Staff
Also included in: Data Representation Powerpoint
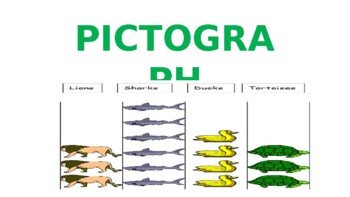
Pictograph Powerpoint
The presentation contains:Learning Objectives.Definition of a Pictograph.Parts of a pictograph.Tips for construction of pictograph.Steps to construct pictograph with an example.Scaling and drawing a pictograph.Read and Interpret a pictograph.
Subjects:
Grades:
1st - 7th, Staff
Also included in: Data Representation Powerpoint
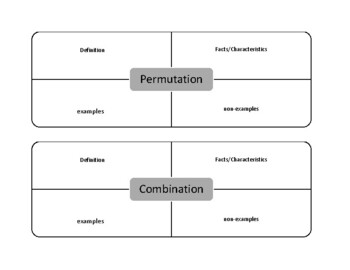
Grade 12 Data Management MDM4U Statistics Math Ch5 Combination
The lesson notes provide learning goals for each subtopic which I find quite useful to students. I usually demonstrate an example to students and then let them work on similar questions. We will then take up the questions in class. There are answers to some questions. Other answers will be provided upon request. The product includes lesson notes and practices on the following topics:Comparison between permutation and combinationVenn DiagramCombinationCombination & Binomial Theorem
Subjects:
Grades:
10th - 12th, Higher Education, Staff
Types:
TRIGONOMETRY: THE TRANSFORMATION OF SINE & COSINE FUNCTIONS
To transform a graph of a function means to shift its graph to the left or right hand side, stretch/shrink vertically or horizontally, or to reflect its graph across the x-axis or the y-axis. In this document, the students will learn about what it means to transform sine and cosine functions. Illustrated examples are also given.
Subjects:
Grades:
10th - 12th, Higher Education, Adult Education, Staff
Types:
The Graphs of Trigonometric functions
In this e-book, the graphs of sine, cosine, tangent, cosecant, secant and cotangent functions are given and discussed.
In particular, we discuss:
1. The domain
2. The range
3. The period
4. The x-intercept(s)
5. The y-intercept
6. The vertical asymptote
Subjects:
Grades:
9th - 12th, Higher Education, Adult Education, Staff
Types:
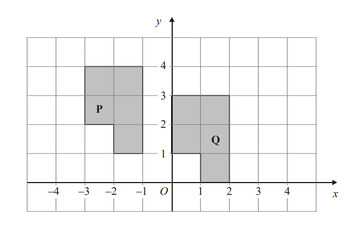
Midpoint of a Line, Translation and Reflection of 2D Shapes. PPT File
This is a power point presentation that covers the topic midpoint of a line segment, the coordinate of a point that lies a fraction of a line segment. Translation of 2D shapes with examples that cover performing the translation and describing the translation.Reflection of 2D shapes with examples that cover performing the reflection and describing the reflection.
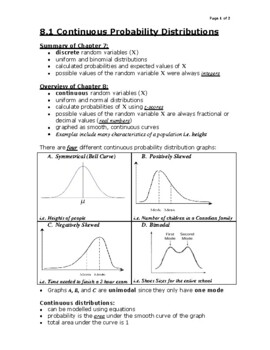
Grade 12 Data Management MDM4U Statistics Math Ch8 Normal Distribution
The lesson notes provide learning goals for each subtopic which I find quite useful to students. I usually demonstrate an example to students and then let them work on similar questions. We will then take up the questions in class. There are answers to some questions. Other answers will be provided upon request. The product includes lesson notes and practices on the following topics:Continuous Probability DistributionProperties of normal distributionNormal Approximation to Binomial DistributionH
Subjects:
Grades:
10th - 12th, Higher Education, Staff
Types:
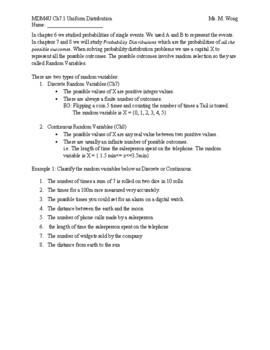
Grade 12 Data Management MDM4U Statistics Math Ch7 Probability Distributions
The lesson notes provide learning goals for each subtopic which I find quite useful to students. I usually demonstrate an example to students and then let them work on similar questions. We will then take up the questions in class. There are answers to some questions. Other answers will be provided upon request. The product includes lesson notes and practices on the following topics:Uniform Distributionbinomial DistributionGeometric DistributionHypergeometric Distribution
Subjects:
Grades:
10th - 12th, Higher Education, Staff
Types:
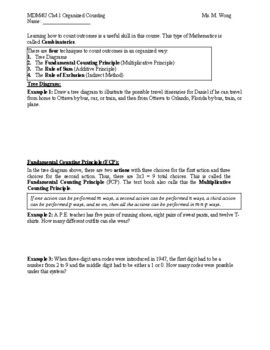
Grade 12 Data Management MDM4U Statistics Math Ch4 Permutation
The lesson notes provide learning goals for each subtopic which I find quite useful to students. I usually demonstrate an example to students and then let them work on similar questions. We will then take up the questions in class. There are answers to some questions. Other answers will be provided upon request. The product includes lesson notes and practices on the following topics:Organized Counting and Tree DiagramFactorial and PermutationPermutation with identical itemsPascal's triangleAppli
Subjects:
Grades:
10th - 12th, Higher Education, Staff
Types:
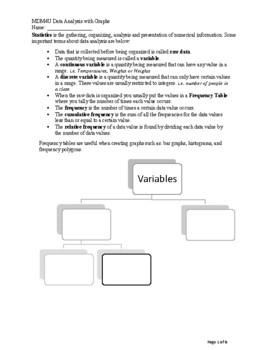
Grade 12 Data Management MDM4U Statistics Math Ch2 Statistics of One Variable
The lesson notes provide learning goals for each subtopic which I find quite useful to students. I usually demonstrate an example to students and then let them work on similar questions. We will then take up the questions in class. There are answers to some questions. Other answers will be provided upon request. The product includes lesson notes and practices on the following topics:Types of graphsSamplingBiasMeasures of Central TendencyMeasures of Spread
Subjects:
Grades:
10th - 12th, Higher Education, Staff
Types:

Grade 12 Data Management MDM4U Statistics Math Ch6 Probability
The lesson notes provide learning goals for each subtopic which I find quite useful to students. I usually demonstrate an example to students and then let them work on similar questions. We will then take up the questions in class. There are answers to some questions. Other answers will be provided upon request. The product includes lesson notes and practices on the following topics:Counting & Statistic fluctuationOdds in favour of and against an eventProbabilities involving counting techniq
Subjects:
Grades:
10th - 12th, Higher Education, Staff
Types:
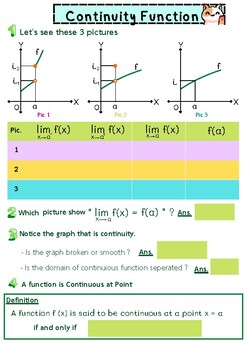
Continuous at Point
Pre-Calculus/Continuous Function/Limit&ContinuityTo introduce the continuity function at point by seeing the graph.
Subjects:
Grades:
10th - 12th, Higher Education, Staff
Types:
CCSS:
NGSS:
HS-PS4-5
Showing 1-24 of 24 results


