78 results
Graphing professional documents for staff and administrators
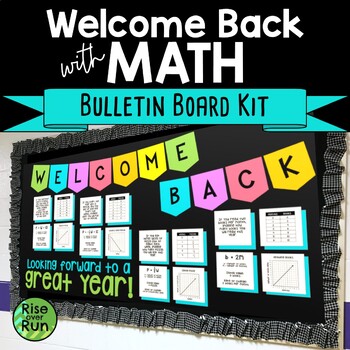
Math Bulletin Board Kit for Back to School
Welcome students with eye-catching math classroom decoration! This board will get students thinking about graphing and real world linear relationships in a fun way. Included are pennants to spell out “Welcome Back” and letters to spell out “Looking forward to a great year!” Four sets of linear functions are included. Each one has a story, an equation, a table of values, and a graph. This bulletin board would be perfect for a secondary math classroom or in a hallway. The math relates to math
Subjects:
Grades:
7th - 12th
Also included in: Math Bulletin Boards Bundle for All Year
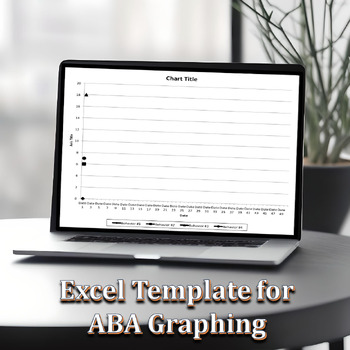
Excel Graphing Template for ABA
Use this Excel template to create a line graph in proper ABA format for behavioral data. An example of a graph is provided in this template. You may graph up to 4 behaviors at a time. To use: 1. Open the Excel file2. Fill in the 4 behaviors you would like to graph at the top (to replace Beh #1, Beh #2, etc)3. Fill in the dates you have data for (this graph is designed to hold 50 days worth of data)4. Fill in your behavioral data in the columns for each behavior5. Watch your graph change as you t
Subjects:
Grades:
Staff
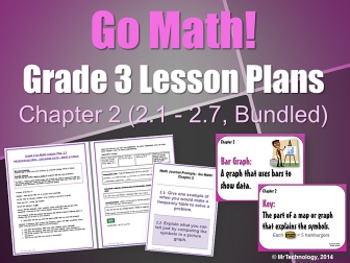
Go Math Grade 3 Chapter 2 Lesson Plans, Journal Prompts & Vocabulary Posters
***ENTIRE GRADE 3 - GO-MATH CHAPTER 2 BUNDLED ***Go-Math Grade 3 Chapter 2 (Lessons 2.1 - 2.7 with Journal Prompts & Vocabulary).Lesson Topics Included in the Bundle:• PROBLEM SOLVING – ORGANIZE DATA – MAKE A TABLE• USE PICTURE GRAPHS• MAKE PICTURE GRAPHS• USE BAR GRAPHS• MAKE BAR GRAPHS• SOLVE PROBLEMS USING DATA• USE AND MAKE LINE PLOTS• Entire Chapter 2 Journal Prompts and beautiful NEW Vocabulary Posters for a Word WallLike what you see? Looking to $AVE even MORE? Check out ourGo Math G
Subjects:
Grades:
3rd
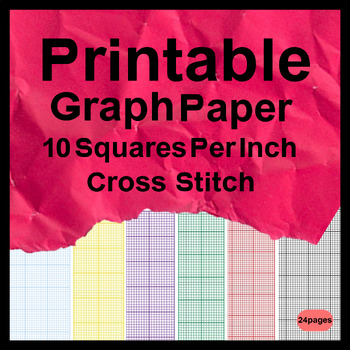
Printable Graph Paper 10 Squares Per Inch Cross Stitch
Printable Graph Paper 10 Squares Per Inch Cross Stitch - Grid paper is essentially the type of paper most commonly used for drawing and sketching purposes. It is widely used for making plan charts, designing websites, developing home ideas and so forth. A great deal of businesses who need to produce a company card, business brochures, catalogues, brochures, and so forth need this kind of graph paper.
Subjects:
Grades:
5th - 12th
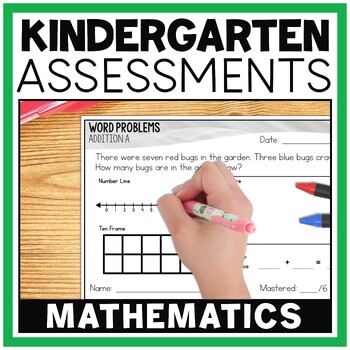
Kindergarten Math Assessments for the Year
Quality kindergarten math assessments are a must-have for your classroom! Throughout the year you will constantly be assessing your students. If you are looking for a quick and simple way to manage this task, Rapid Results half-page kindergarten math assessments are perfect for you! The kindergarten math assessments were developed to provide you with an easy way to test your students on concepts they are required to learn.How many assessments are included?There are 185 math assessments in your d
Subjects:
Grades:
K
Also included in: Kindergarten Beginning of the Year Assessments for Math and Literacy
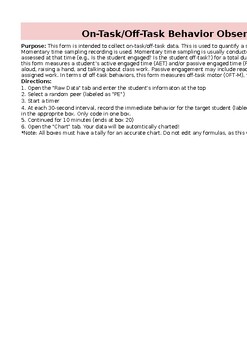
Behavior Observation Academic Engagement and Time on Task (BOSS) AUTO GRAPH
This form is intended to collect on-task/off-task data. It will AUTO graph. This is used to quantify a student's academic engagement and off-task behaviors. Momentary time sampling recording is used. This form measures a student’s active engaged time (AET) and/or passive engaged time (PET). In terms of off-task behaviors, this form measures off-task motor (OFT-M), verbal (OFT-V), and passive behaviors (OFT-P). EXCEL DOCUMENT.
Subjects:
Grades:
Not Grade Specific
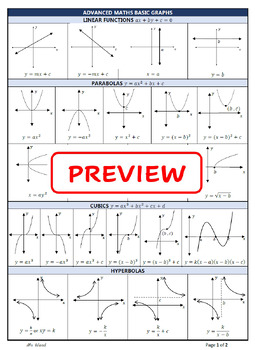
NSW Stage 6 FUNCTIONS - Basic graphs summary
A 2 page PDF summary of the basic graphs required for the NSW Advanced Mathematics course and simple transformations.Lines, Parabolas, Cubic's, Hyperbolas, Circles, Semi-circles, Absolute values, Exponentials, Logarithms and Trigonometric Curves.
Subjects:
Grades:
10th - 12th, Staff
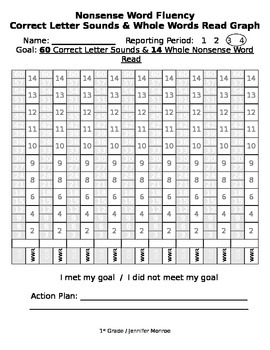
Nonsense Word Fluency Graphs aligned with DIBELS Benchmark Goals Common Core
This is a wonderful tool to show students their gains in reading as you progress monitor them using DIBELS Next or any other fluency assessments. This graph is to be used during the 3rd and 4th nine weeks, as the goals are aligned with the benchmark goals for DIBELS Next. There is nine weeks worth of graphing space if you progress monitor your students every other week. The first column allows the students to graph how many Correct Letter Sounds they read in 1 minute. The second column has them
Grades:
1st
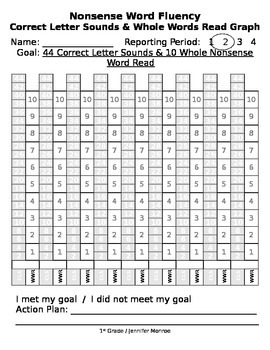
Nonsense Word Fluency Graphs Aligned with DIBELS Benchmark Goals Common Core
This is a wonderful tool to show students their gains in reading as you progress monitor them using DIBELS Next or any other fluency assessments. This graph is to be used during the 1st and 2nd nine weeks, as the goals are aligned with the benchmark goals for DIBELS Next. There is nine weeks worth of graphing space if you progress monitor your students every other week. The first column allows the students to graph how many Correct Letter Sounds they read in 1 minute. The second column has t
Grades:
1st
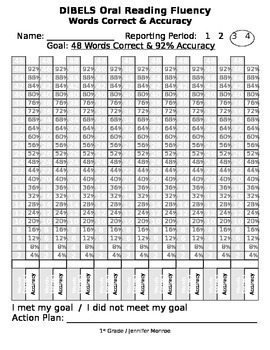
Oral Reading Fluency Words Correct and Accuracy Graphs aligned with DIBELS goals
This is a wonderful tool to show students their gains in reading as you progress monitor them using DIBELS Next or any other fluency assessments. This graph is to be used during the 3rd and 4th nine weeks, as the goals are aligned with the benchmark goals for DIBELS Next. There is nine weeks worth of graphing space if you progress monitor your students every other week. The first column allows the students to graph how many Words Correct they read in 1 minute. The second column has them graph wh
Grades:
1st

3rd Grade - Skill Support Resource Packet
This large resource is a 382 page packet of skills with solutions for additional skill practice.A Table of Contents is supplied to provide easy reference to skill pages. Instant downloading of skills for immediate use in the classroom.It contains almost all the skills for the 3rd grade with multiple versions on specific skills regardless of state standards (i.e. place value - complete, coins, clocks, computational skills, number line/domino models, geometry - 2D/3D, fractions, computational pi
Subjects:
Grades:
3rd
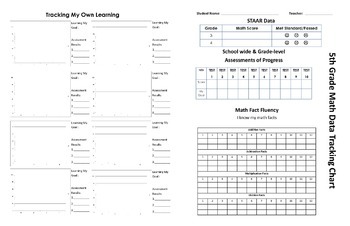
5th Grade STAAR Student Goal Setting & Assessment Tracker
Students and Teachers can learn a lot about their own thinking and learning by goal setting and tracking their progress.
These 11x17 goal setting and data tracking folders not only serve as a way to intrinsically motivate your students, but also allows you to guide students to setting those goals.
Students can goal set, track tests/assessments, math fact fluency to help them become aware of their strengths and weaknesses.
Subjects:
Grades:
5th
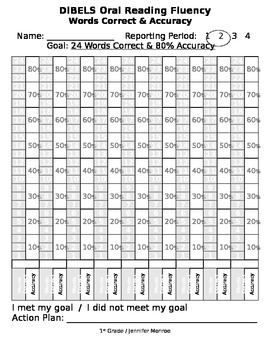
Oral Reading Fluency Words Correct and Accuracy Graphs aligned with DIBELS goals
This is a wonderful tool to show students their gains in reading as you progress monitor them using DIBELS Next or any other fluency assessments. This graph is to be used during the 1st and 2nd nine weeks, as the goals are aligned with the benchmark goals for DIBELS Next. There is nine weeks worth of graphing space if you progress monitor your students every other week. The first column allows the students to graph how many Words Correct they read in 1 minute. The second column has them graph wh
Grades:
1st
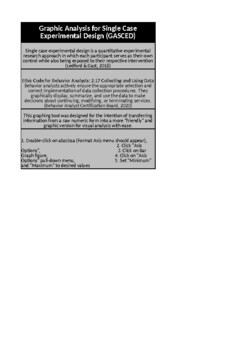
Graphic Analysis for Single Case Experimental Design (GASCED)
This graphing tool was designed for the intention of transferring information from a raw numeric form into a more "friendly" and graphic version for visual analysis with ease. While this tool can be used for single case research design, it can also be used for IEP data. It is important for all special educators to a) take data & b) present that data in a way that everyone can understand. This tool can help with IEP compliance.
Grades:
Not Grade Specific
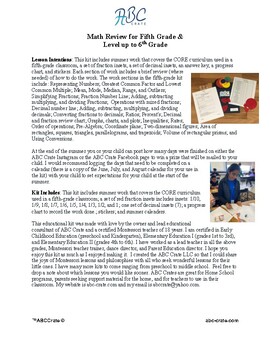
Math Review Fifth Grade & Level Up to Sixth Grade
This kit includes summer work that covers the CORE curriculum used in a fifth grade classroom, a set of fraction insets to cut out, a set of decimal insets to cut out, an answer key, and a progress chart. Each section of work includes a brief review (where needed) of how to do the work. The work sections in the fifth grade kit include: Representing Numbers; Greatest Common Factor and Lowest Common Multiple; Mean, Mode, Median, Range, and Outliers; Simplifying Fractions; Fraction Number Line; Add
Subjects:
Grades:
5th - 6th
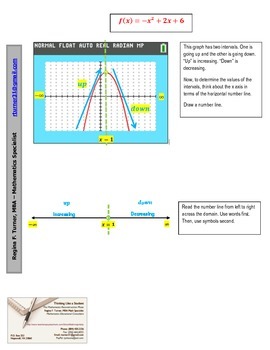
Identifying Increasing and Decreasing Intervals - Quadratic Functions
This document is a "How to Guide" that offers step by step instructions on how to identify increasing and decreasing intervals of polynomial functions. It uses a quadratic example to get students started with the concept of a turning point, what that actually means, and how intervals relate to the domain, x-axis, and a visual of the number line.
This is a great reference for your algebra one, algebra two, and even pre-calc classes!
Subjects:
Grades:
7th - 12th
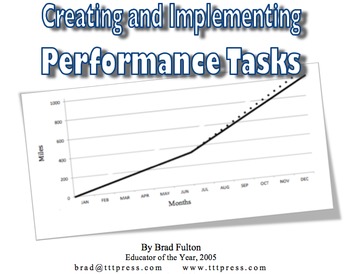
Creating and Implementing Common Core Math Performance Tasks
Performance tasks are designed not only to demonstrate a student’s proficiency with mastery of math content, they also give us an indication of how he or she is using the eight mathematical practices.
How we effectively implement these tasks is critical to our success as math teachers. Finding and creating performance tasks can be easy using these simple guidelines.
Two performance tasks are included as examples with ideas for assessment as well.
Subjects:
Grades:
5th - 9th
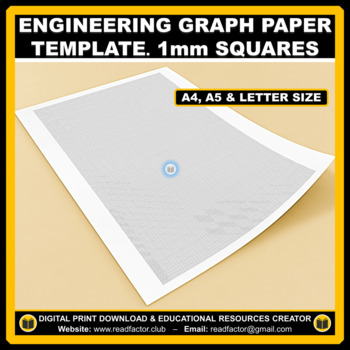
Engineering Graph Paper Template 1 mm Squares - A4, A5 & Letter Size
Engineering Graph Paper Template 1mm Squares - A4, A5 & Letter Size Engineering Graph Paper is necessary to help you draw the required object with high quality.We really appreciate you purchasing our digital resources and we hope you'll enjoy using them.Please FOLLOW US if you'd like to receive notifications when we upload new products and freebies.DOWNLOAD. PRINT. DONE!RATING AFTER DOWNLOADING IS VERY APPRECIATED.
Subjects:
Grades:
Not Grade Specific
Also included in: BUNDLE Writing Paper Templates - 123 Worksheets
REVISEDGrade 1 Unit 3 Data Strand (Data Literacy)
This is the third unir in a series of eleven different math units. They loosely follow the Nelson’s math program but have been enriched with interactive smartboard games and higher-level thinking activities. All eleven units cover the new 2020 Ontario mathematics curriculum expectations for Grade One students. This unit includes everything from start to finish so you can just concentrate on teaching.Overall / Specific Grade level expectationsBig IdeasMarks/ record sheetVery specific anecdotal /
Subjects:
Grades:
1st
Also included in: BUNDLE Gr. 1 Math Unit 1,2,3 Pattern & Rel, Whole Numbers, Data Literacy
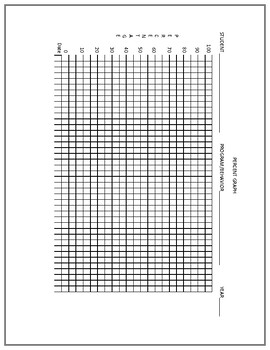
Percentage Graph
An easy to use percentage graph to chart progress in an educational or a behavioral program. Can be used as a line graph or a bar graph with x and y axis components. Data points, phase change line, and or phase labels can be entered throughout the graph.
Subjects:
Grades:
Not Grade Specific
Patterns, Functions, and Algebra for Math 6-8
Are you a math coach, specialist, department chair, lead teacher, or administrator? If so, this document is for you! Use this flipchart for Professional Development or training purposes.
It targets scaffolding, alignment, using data to enhance instruction, and improve students' academic achievement. Step by step directions and pedagogical strategies are provided. Thought provoking activities and questioning are incorporated throughout each presentation.
The series:
1-Number and Number Sense
Subjects:
Grades:
5th - 9th
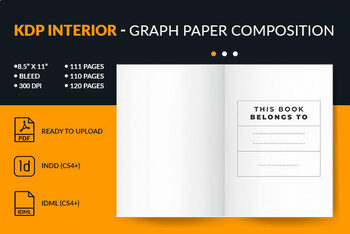
Graph Paper Composition Interior for KDP 8.5x11 Inches
Graph Paper Composition Notebook, Kdp Interior, (100,110,120pages), Ready to Upload Specifications: • 8.5” x 11” Inches • 111 pages • 110 pages • 120 pages • Black and White • PDF file 100% ready for Amazon KDP uploading • Fully editable • File Formats : INDD (CS4+), IDML (CS4+), PDF • Interior Only, you need to create your own covers. Thanks, and enjoy!
Subjects:
Grades:
Not Grade Specific

Geometry Logic and Reasoning
Are you a math coach, specialist, department chair, lead teacher, or administrator? If so, this document is for you! Use this flipchart for Professional Development or training purposes.
It targets scaffolding, alignment, using data to enhance instruction, and improve students' academic achievement. Step by step directions and pedagogical strategies are provided. Thought provoking activities and questioning are incorporated throughout each presentation.
The series:
1-Logic and Reasoning
2-Li
Subjects:
Grades:
7th - 11th
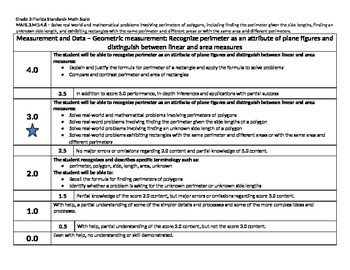
Scale Math Florida Standard 3rd Grade MAFS.3.MD.4.8 Measurement Data 3MD48 Gr 3
This is a scale for the Florida Standard Math Standard MAFS.3.MD.4.8. It's a 0-4 scale, with 3 being the proficient level of mastering the standard. Please check out my numerous other scales as well.
Subjects:
Grades:
3rd
Showing 1-24 of 78 results


