364 results
Statistics handouts for homeschool
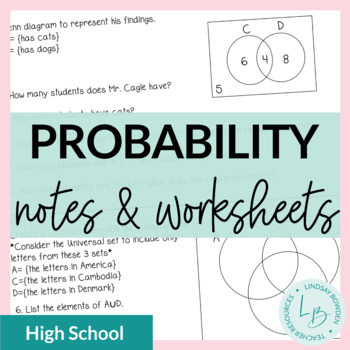
Probability Guided Notes and Worksheets
These probability notes and worksheets cover all of the compound and conditionality probability standards for high school. Topics covered: set theory (union, intersection, complement, Venn diagrams) outcomes and basic probability (coins, dice, tree diagrams, Fundamental Counting Principle)compound probability (addition and multiplication rules) conditional probability (both independent and dependent) Students must have a basic knowledge of a standard deck of playing cards to complete some of the
Subjects:
Grades:
9th - 11th
Types:
CCSS:
Also included in: Probability Unit Bundle
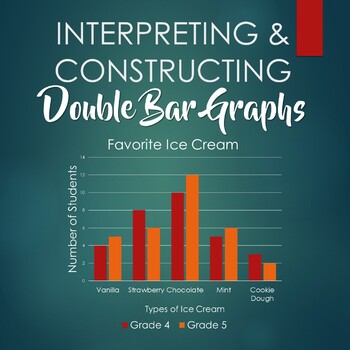
Interpreting and Constructing Double Bar Graphs - Booklet
This booklet includes six worksheets:- 3 double bar graphs for students to interpret- 3 sets of data for students to construct double bar graphs, with corresponding questions- answer key
Subjects:
Grades:
3rd - 6th
Types:
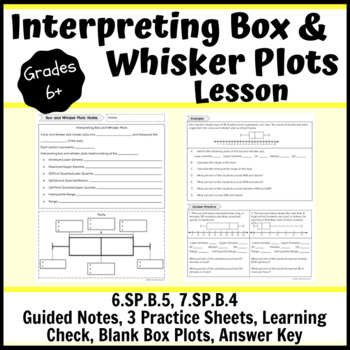
Interpreting Box and Whisker Plots Lesson- Notes, Practice, Learning Check
This interpreting box and whisker plots lesson consists of a guided notes sheet, 3 practice sheets, a learning check, 2 different half sheets of blank box plots and an answer key. You can hole punch the note pages and have students place them in their binders or a 3-prong folder. There are teacher notes to guide you through the direct instruction with students. There are three pages of practice. One page can be used as independent practice when students are ready; this could be in class or homew
Subjects:
Grades:
6th - 10th
Types:
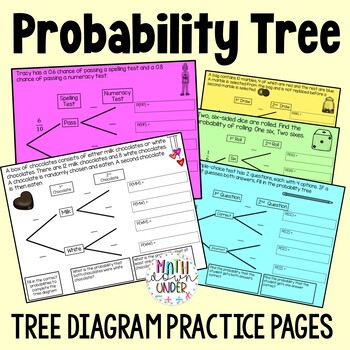
Probability Tree Diagrams Practice Pages - Independent and Dependent Events
Your students will love practicing drawing tree diagrams to solve compound probability events with these 10 printable practice pages. Independent and Dependent events are included.Starting with structured scaffolding, students are introduced to the process of creating probability trees by filling in the blanks. This approach builds confidence and ensures students grasp the fundamentals before advancing. Gradually, the scaffolding is removed, presenting blank templates that encourage students to
Subjects:
Grades:
6th - 10th
Types:
Also included in: Compound Probability Activity & Practice Bundle
Chi Squared
Chi SquaredTeaching Chi Squared to a Stats class or AP Bio and not sure where to start?! Well, you found it. I created this product for my husband, who teaching AP Biology. This pack includes a PPT introduction, complete with student fill-in-the-blank notes, that walk students through the steps of Chi Squared and gives them a general overview of how and why we use this test. Degrees of Freedom are explained, as well as p-value. Notes provide an additional practice problem to do as a class. This
Subjects:
Grades:
9th - 12th

Two-Way Tables and Relative Frequency Doodle Notes
Doodle notes are a tool to help students process information. I’ve found students are more engaged when using doodle notes than traditional notes, and they’re more likely to keep the notes and use them as references.
What’s Included:
The first version of the notes has pre-filled data from a hypothetical class. All of the calculations included on the answer key use this data.
The second version of the notes has a blank table so you can collect data from your class with your students. My s
Subjects:
Grades:
8th - 9th
Types:
CCSS:
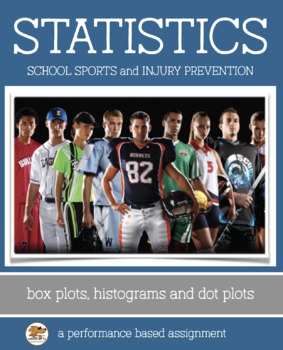
STATISTICS - Histograms, Box Plots, Dot Plots: A Performance-Based Task
Using Statistics in a Real World Scenario
Sports Injury and School Athletes
This packet includes two activities. The first activity guides students through 3 data analyses projects including identifying the best data display (box plot, histogram, dot plot) for the situation. The second activity is a performance task which asks students to critique the reasoning of others and refute a claim. In the process, students will learn that correlation does not imply causation. This can be independently
Subjects:
Grades:
8th - 11th
Types:
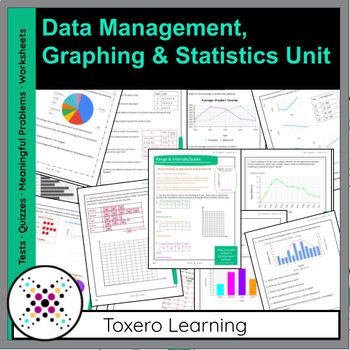
Grade 6, Data Management, Graphing & Statistics (Unit 7)
The Grade 6 Math Program is designed to take the stress out of teaching! It is a fusion of traditional practice, coupled with modern teaching approaches to encourage authentic learning and deeper thinking.Each unit can be successfully executed individually, but were ideally designed to go in consecutive order for the year. Some concepts reappear in other units to encourage a holistic approach to mathematics. Algebra is intentionally woven throughout the entire Grade 8 Program to provide ample an
Subjects:
Grades:
5th - 7th
Types:
Also included in: Grade 6 Math Year with EDITABLE Assessments, Growing Bundle
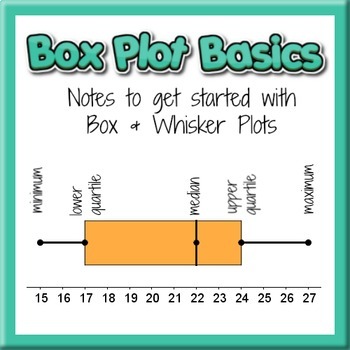
Box Plot Basics Notes to get started - WITH GOOGLE SLIDES for DISTANCE LEARNING
Want a quick, & easy way to make Box Plots simple for your students? This 2-sided notes page with a key is your best starting point!You will receive 2 versions: a PDF and key and a link to a Google Slides version for Distance Learning, including Google Classroom! You need a Google account to access the digital version.These pages can be used in a variety of ways. You may choose to use them for homework or for teaching notes, as you walk your students through the process of finding the 5-nu
Subjects:
Grades:
6th - 7th
Types:
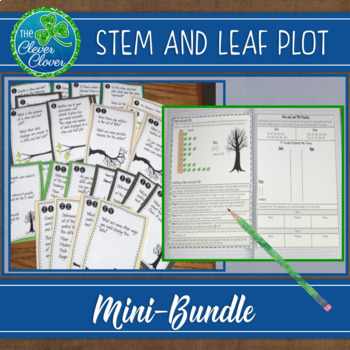
Stem and Leaf Plots - Guided Notes, Task Cards & an Assessment
This stem and leaf plot resource includes guided notes, a practice page, task cards and an assessment. Your students will have the opportunity to discuss the measures of central tendency and to analyze and create stem and leaf plots. Below, you will find detailed explanations on the notes, practice problem, task cards and the assessment.
Guided Notes
Included, you will find a guided page of notes that students can use to create their stem and leaf plots. The notes include step by step instruct
Subjects:
Grades:
6th - 9th
Types:
CCSS:
Also included in: Statistics Bundle - Guided Notes, Worksheets & Scavenger Hunts!
AP Psych / AP Psychology - Unit 1: Scientific Foundations - Activity Pack!
Includes the wildly popular ESCAPE ROOM Activity, as well as analyzes and practices nearly all standards regarding Unit 1: Scientific Foundations of Psychology, including 1.B, 1.C, 1.E, 1.F, 1.G, 1.H, 1.I, 1.J, 1.L, 1.M, 1.N, and 1.O!In class or as homework, students must assess, analyze, graph, calculate, and interpret data regarding psychological studies. All questions are original, and modeled after the College Board format and difficulty. After learning about the topics in class, these are
Subjects:
Grades:
8th - 12th, Higher Education, Adult Education, Staff
Types:
Box and Whisker/Stem and Leaf Graphs based on "The Hunger Games"&"Harry Potter"
Need to grab the attention of your students? Try using data from "The Hunger Games" series by Suzanne Collins and the "Harry Potter" series by J.K. Rowling!The first activity is a box and whisker graph lesson. It includes notes, a data sheet (ages of tributes), a twelve question activity, and an answer key. It makes a great one period activity or assignment.A second activity using data related to "The Hunger Games" (gross daily earnings) and "Harry Potter" (fictitious survey) series includes t
Subjects:
Grades:
6th - 9th
Types:

STATISTICS - Comparing Center and Spread
Descriptive Statistics / Common Core HSS.ID.A.2
Included in this packet
•Note-taking Sheet
•Assignment sheet
•Keys for Notes and Practice are also included.
This activity focuses on comparing the center (mean and median) and spread (standard deviation and interquartile range) of a data set.
Students will be expected to identify the mean, median, IQR and standard deviation of the data, and to know which measures are appropriate for which type of distribution (normal or skewed).
The activity c
Subjects:
Grades:
8th - 11th
Types:
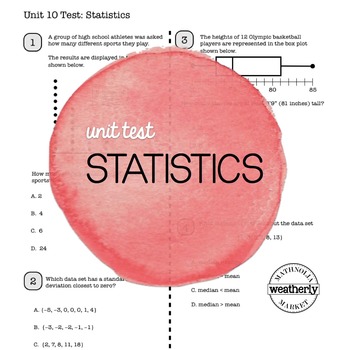
STATISTICS Unit Test CC Algebra 1
The Algebra I Common Core Unit Test will assess your students’ understanding of STATISTICS
Included topics:
Graphical Displays
Quartiles
Box Plots
Measures of Central Tendency
Variation
Two Way Frequency Tables
BiVariate Data
Linear Regression
Quantifying Predictability
Residuals
This assessment can serve as a test at the end of the unit, as a diagnostic tool prior to teaching the topics or as a “test prep” activity prior to state testing.
CCSS addressed:
N-Q.1
S-ID.1
S-ID.2
S-ID.3
S-ID.5
Subjects:
Grades:
9th - 12th
Types:
CCSS:
Also included in: Algebra 1 assessments - UNIT TEST BUNDLE
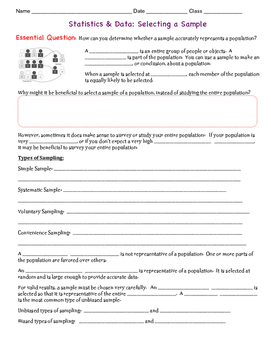
Random Samples and Unbiased Samples to Represent Populations
Guided Notes to help students understand what it means to collect a random and unbiased sample of a population, and the different types of sampling.
Students will be asked if given samples are random and unbiased, and must explain why or why not.
2 pages plus answer key.
Subjects:
Grades:
6th - 8th
CCSS:
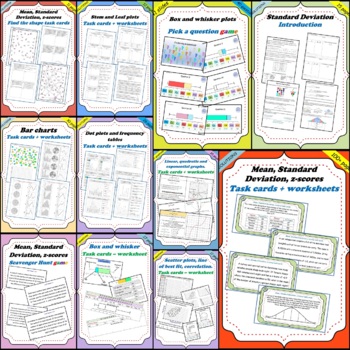
Statistics and charts + Statistics data distribution BUNDLE (450 pages)
This is a bundle package of all of my "Statistics and charts" AND MY "Statistics data distribution" products for a reduced price. This includes a total of 11 products:Statistics and charts:Bar charts, histograms and Circle graphs (1 product, 32 pages).Frequency tables and dot plots (1 product, 28 pages).Stem and leaf plots (1 product, 14 pages).Statistics data distribution:Quartiles and Box and whisker plots (2 products, , 28 pages + 41 slides).Mean, Standard Deviation, z-scores (4 products, 237
Subjects:
Grades:
10th - 12th, Adult Education
Types:
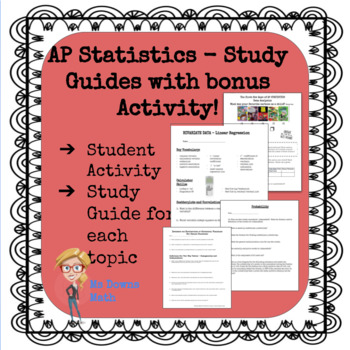
AP Statistics Study Guides - All Topics!
There is a pdf file study guide for each topic in the AP Statistics curriculum. Exploring Data, Normal Distributions, Linear Regressions, Experiments and Designing Studies, Probability, Random Variables, Sampling Distributions, Confidence Intervals, Hypothesis Tests, Comparing Populations, Chi Square Procedures, and Inference about Regression. I have students complete one for each unit. At the end of the year, they have a great study packet for the AP Exam! Student feedback has indicated that th
Subjects:
Grades:
9th - 12th, Higher Education, Adult Education
Types:
CCSS:
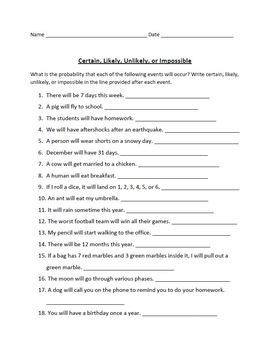
Probability: Certainly, Likely, Unlikely, or Impossible Worksheet
Students will be asked to write if the events given will certainly occur, are likely to occur, are unlikely to occur, or impossible. An answer key is included.
Subjects:
Grades:
2nd - 5th
Types:
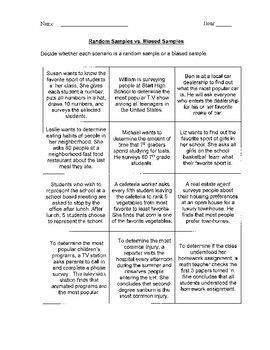
Random or Biased Sample? (Activity/Practice)
This resource can be used as a class activity or individual practice worksheet. Students are given 12 situations to analyze, and they must decide whether each of them represents a random sample or a biased sample. If being used as a class activity, students should cut out the squares (each situation is on one square). They can then tape them onto the board (have the board divided into 2 categories) based on what kind of sample they believe it is. As a class, you can then discuss each situati
Subjects:
Grades:
3rd - 12th
Types:
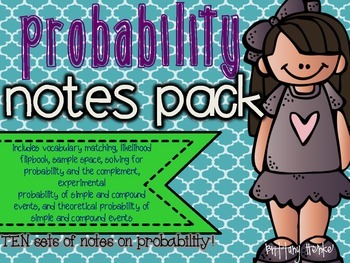
Probability Notes- Pack of TEN!
This product is a pack of TEN scaffolded notes covering probability.The notes are all in the form of foldables and there is one flip book included.
The notes included are:
*vocabulary matching
*likelihood flip book
*representing a sample space
*finding probability and the complement
*experimental probability of simple events
*experimental probability of compound events
*theoretical probability of simple events
*theoretical probability of compound events
ALL of these notes were created with in
Subjects:
Grades:
6th - 8th
Types:
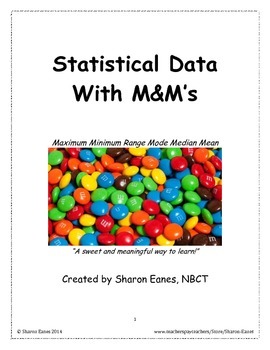
Statistical Data with M&M's
What better way to practice statistical concepts than with edible, chocolate, manipulatives? This hands on activity provides students the opportunity to sort and record data, then use information to determine maximum, minimum, range, mode, median, and mean. In addition, students create a bar graph, charting their data and finish the activity with a written language component. I like to introduce statistics during review of place value and number systems, toward the beginning of the school yea
Subjects:
Grades:
3rd - 6th
Types:
CCSS:
Psychology Random Sample Population Stats M&M Worksheet for Research Methods
Psychology or Statistics Random Sample & Population Statistics M&Ms Worksheet Activity for Research Methods includes a teacher direction sheet with materials that you need and how to complete the activity along with printable handout for students. *Student Favored activity*Please email me with any questions at ReadySetLearnSocialScience@yahoo.comIf you would like to get updates on NEW and CURRENT resources...►FOLLOW Me on Teachers Pay Teachers►FOLLOW Me on Pinterest►FOLLOW Me on Instagr
Subjects:
Grades:
4th - 12th, Adult Education
Types:
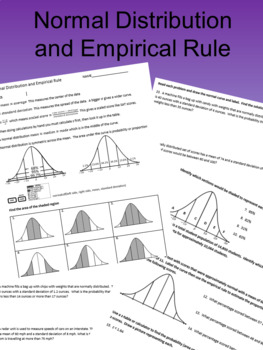
Normal Distribution and Empirical Rule Revised
This is a new and improved version of an older but popular product of mine Normal Distribution and Empirical Rule . It includes notes on the normal distribution with cleaner graphics and all new problems:It then includes 6 problems where they use the empirical rule to estimate the shaded region from a picture. Then 4 problems where they select the regions to give a desired area. A word problem where they label the curve and solve using normal distribution. The second side contains 4 problems wh
Subjects:
Grades:
9th - 12th, Higher Education, Adult Education
Types:
Showing 1-24 of 364 results


