Graphing/Data Management Third Grade Worksheets (bar, circle, pictographs)
What educators are saying
Description
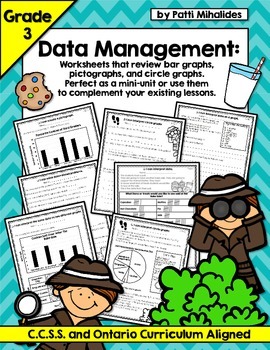
This is a ten-page collection of Math worksheets that covers the following:
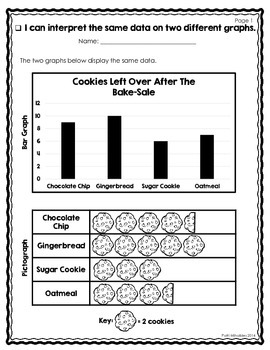
• comparing the same data on a bar graph and pictograph
• writing about what one interprets from a graph (students are encouraged to consider the data on a higher level)
• transferring data from a bar graph to a pictograph (two opportunities to practice this, one more challenging than the other)
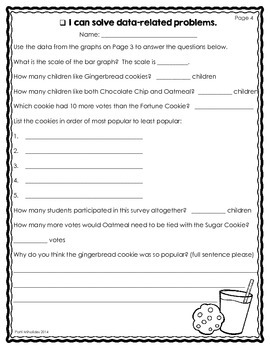
• solve data related problems using addition and subtraction
• respond to higher level thinking, open-ended questions (e.g. Why do you think the gingerbread cookie was so popular?
• students "think like a teacher" and pose their own questions and answers based on data presented
• create a bar graph based on the survey data presented
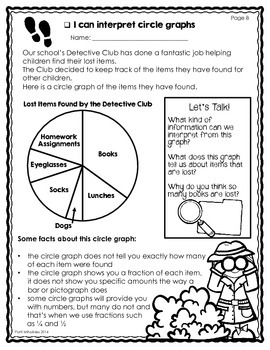
• an introduction to circle graphs and how we use fractional names when no numbers are provided
• solve problems related to interpreting data on a circle graph
• a title page with discussion points -How do we use graphs in our day-to-day lives?
The bar graph/pictograph pages are based on a bake-sale theme, while the circle graphs are based on a school “Detective Club” theme. The pages are engaging and very student-friendly. Please have a look at the preview as it shows all the items included in this product and I think it speaks for itself in terms of identifying the specific concepts covered. This product is both CCSS and Ontario Curriculum Aligned. It is designed for students in Third Grade, but would work well for students in Second Grade working at a higher level or those students in Fourth Grade who require further practice with this strand of the curriculum.
Throughout this product, students are encouraged to consider the data on a higher level and make “outside the box observations” e.g. “I can interpret that the sugar cookie must have been very popular since it has the least left over after the bake sale.”
For those students that finish their work for the day early, I’ve included a page where they will design a poster advertising a school bake sale. This is something meaningful they can work on while they wait for their classmates to finish and can even be used as a Media/Visual Arts mark. It includes a short checklist that outlines the criteria for the task, making it an independent activity with clear expectations.
This product can be used by both American and Canadian teachers.
The entire product is 23 pages, 10 of which are the actual student worksheets.
Thank you for visiting my store. Please ask all questions before purchasing. If there is something I can do to make this product more suitable for your needs, please let me know, I’d be happy to help.
Patti Mihalides
mrs.mihalides@gmail.com


