STATISTICS Unit Test CC Algebra 1
weatherly
967 Followers
Grade Levels
9th - 12th, Homeschool
Subjects
Resource Type
Standards
CCSSHSS-ID.A.1
CCSSHSS-ID.A.2
CCSSHSS-ID.A.3
CCSSHSS-ID.B.5
CCSSHSS-ID.B.6a
Formats Included
- PDF
Pages
13 total, 6 test
weatherly
967 Followers
Also included in
- This bundle includes a complete set of tests for an Algebra course that includes the following CCSS topics: 1.FOUNDATIONS of ALGEBRAstandards addressed; N-Q.1, A-CED.2, A-REI.1, A-SSE.1(b), A-SSE.2, A-SSE.3(c), A-CED.12.LINEAR EXPRESSIONS, EQUATIONS and INEQUALITIESstandards addressed; A-REI.1, A-REPrice $32.50Original Price $41.25Save $8.75
Description
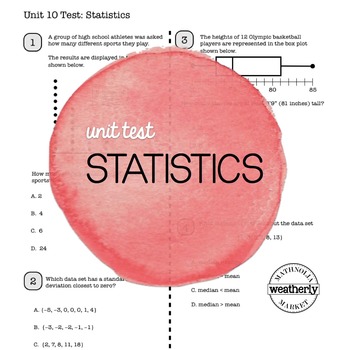
The Algebra I Common Core Unit Test will assess your students’ understanding of STATISTICS
Included topics:
Graphical Displays
Quartiles
Box Plots
Measures of Central Tendency
Variation
Two Way Frequency Tables
BiVariate Data
Linear Regression
Quantifying Predictability
Residuals
This assessment can serve as a test at the end of the unit, as a diagnostic tool prior to teaching the topics or as a “test prep” activity prior to state testing.
CCSS addressed:
N-Q.1
S-ID.1
S-ID.2
S-ID.3
S-ID.5
S-ID.6(a,b,c)
S-ID.7
S-ID.8
S-ID.9
Consider all the Unit Tests in this series:
UNIT 1 - Foundations of Algebra
UNIT 2 - Linear Equations, Expressions, and Inequalities
UNIT 3 - Functions
UNIT 4 - Linear Functions and Arithmetic Sequences
UNIT 5 - Systems of Linear Equations and Inequalities
UNIT 6 - Exponents
UNIT 7 - Polynomials
UNIT 8 - Quadratic Functions
UNIT 9 - Roots and Irrational Numbers
UNIT 10 - Statistics
Total Pages
13 total, 6 test
Answer Key
Included
Teaching Duration
N/A
Report this resource to TPT
Reported resources will be reviewed by our team. Report this resource to let us know if this resource violates TPT’s content guidelines.
Standards
to see state-specific standards (only available in the US).
CCSSHSS-ID.A.1
Represent data with plots on the real number line (dot plots, histograms, and box plots).
CCSSHSS-ID.A.2
Use statistics appropriate to the shape of the data distribution to compare center (median, mean) and spread (interquartile range, standard deviation) of two or more different data sets.
CCSSHSS-ID.A.3
Interpret differences in shape, center, and spread in the context of the data sets, accounting for possible effects of extreme data points (outliers).
CCSSHSS-ID.B.5
Summarize categorical data for two categories in two-way frequency tables. Interpret relative frequencies in the context of the data (including joint, marginal, and conditional relative frequencies). Recognize possible associations and trends in the data.
CCSSHSS-ID.B.6a
Fit a function to the data; use functions fitted to data to solve problems in the context of the data.


