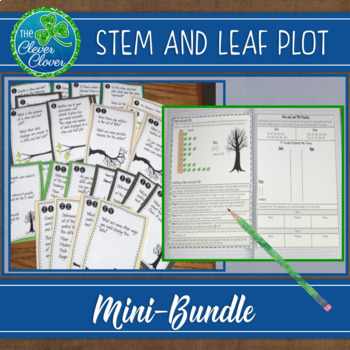
Stem and Leaf Plots - Guided Notes, Task Cards & an Assessment
The Clever Clover
2.3k Followers
Grade Levels
6th - 9th, Homeschool
Subjects
Resource Type
Standards
CCSS6.SP.A.2
Formats Included
- Zip
Pages
12 + answer document
The Clever Clover
2.3k Followers
What educators are saying
Love your resources! So helpful during my cram session before testing. The students enjoyed the task cards!
Also included in
- Are your kids studying the measures of central tendency, box and whisker plots, stem and leaf plots, two-way tables, histograms and scatter plots? This valuable resource includes guided notes, worksheets, scavenger hunts, assessments and more that you can use for your statistics unit. Below you willPrice $20.80Original Price $26.00Save $5.20
Description
This stem and leaf plot resource includes guided notes, a practice page, task cards and an assessment. Your students will have the opportunity to discuss the measures of central tendency and to analyze and create stem and leaf plots. Below, you will find detailed explanations on the notes, practice problem, task cards and the assessment.
Guided Notes
Included, you will find a guided page of notes that students can use to create their stem and leaf plots. The notes include step by step instructions that can be referenced as students study stem and leaf plots. The smaller page of notes can be glued directly into their notebooks.
Practice Problem
In addition to the notes, there is a guided practice problem on a back to back stem and leaf plot that can be glued into the notebook as well. Students can use the step by step guided notes page to help create this stem and leaf plot. It may be helpful to create the stem and leaf plot as a class while referencing each step of the guided notes.
Task Cards
Included with the notes and practice problem, is a station activity with 24 task cards about stem and leaf plots. Students are asked to create stem and leaf plots, calculate the measures of central tendency and to identify the sample size. Some questions are open ended asking students to analyze the data and to make some conclusions. Students are asked to identify outliers and to describe what would happen to the measures of central tendency if the outlier was removed. The last four cards ask students to create their own stem and leaf plot, determine the measures of central tendency, determine which measure best describes the data and to list other possible displays for the data. An answer document is provided for students to record their answers.
Assessment
Lastly, a twelve question assessment can be used assess student understanding of stem and leaf plots. Students are asked to interpret data from a stem and leaf plot as well as create a stem and leaf plot from a set of data. Various other questions ask about the measures of central tendency and outliers.
Answer keys are included.
Leaving feedback will earn you credits for future TPT resources. Follow me to receive discounts for the first 24 hours on new resources.
Please contact me if you have any questions. The Clever Clover
Connect with me on social media!
The Clever Clover - Pinterest
The Clever Clover - Instagram
The Clever Clover - Facebook
Total Pages
12 + answer document
Answer Key
Included
Teaching Duration
2 days
Report this resource to TPT
Reported resources will be reviewed by our team. Report this resource to let us know if this resource violates TPT’s content guidelines.
Standards
to see state-specific standards (only available in the US).
CCSS6.SP.A.2
Understand that a set of data collected to answer a statistical question has a distribution which can be described by its center, spread, and overall shape.


