49 results
Graphing webquests for International Baccalaureate
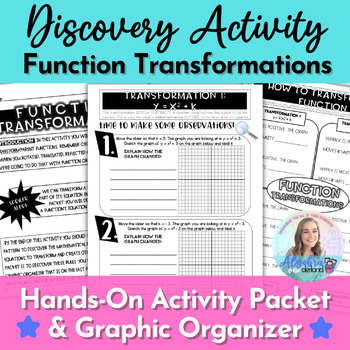
Algebra 1 Function Transformation Parent Functions Hands On Discovery Activity
Help students discovery the rules for function transformations with this hands-on activity! Students will graph function transformations and come to a conclusion about how changing the equation affects change in the graph.Included:Activity packet with: Four graphing tasks to discover the rules. One graphic organizer to generalize the rulesAnswer KeyFlexible for your needs: Students can use any graphing tool such as TI Calculators or the Desmos Online Calculator or TI Calculators.Included: easy-t
Subjects:
Grades:
8th - 12th
CCSS:
Also included in: Algebra 1 Function Transformations Unit Activities, Project and Test
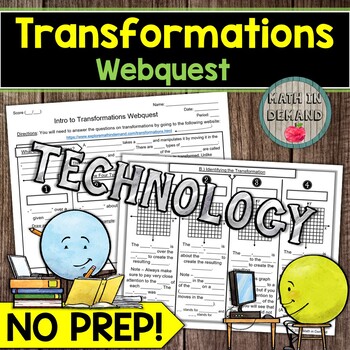
Transformations Webquest Reflection Rotation Translation Dilation
Students will need a device for my math webquest on transformations. Students will be given a link that goes to my website containing information about reflections, rotations, translations, and dilations. Students will learn how to: (1) identify a transformation, (2) perform a transformation, and (3) use the transformation rules to give the coordinates of an image. I have included a worksheet that aligns to the information on my website. All you need to do is print and go! In addition, there is

Slope-Intercept Form Webquest Math
Students will need a device for my math webquest on slope-intercept form. Students will be given a link that goes to my website containing information about slope-intercept form. Students will learn how to: (1) identify the slope and y-intercept of an equation given in slope-intercept form, (2) graph an equation in slope-intercept form, (3) write an equation in slope-intercept form given a linear graph, and (4) convert to slope-intercept form by solving for y. I have included a worksheet that a
Grades:
7th - 8th
Types:
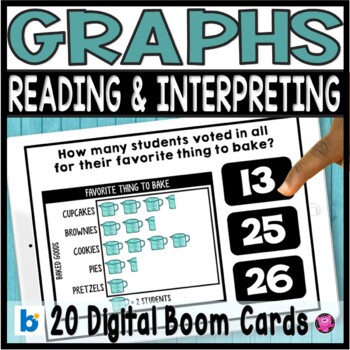
Reading Pictographs - Picture Graphs - Reading and Interpreting Data
These DIGITAL Picture Graphs are a super fun and interactive math activity for your 1st, 2nd, and 3rd grade students to practice reading, analyzing, and interpreting data! Students will answer use picture graphs, and bar graphs to answer questions like: most/least favorites, totals for each group, and compare, analyzing, and interpreting data. Boom Card can be used with Google Classroom, SeeSaw, ClassDoJo and other platforms. Click here to SAVE 20% on my Graphing Bundle!PLEASE NOTE YOU ARE PURCH
Subjects:
Grades:
1st - 3rd
Types:
Also included in: Kindergarten Math Worksheets Games and Centers YEAR-LONG BUNDLE

Intro to Economics Webquest
This webquest allows students to choose a combination of videos, podcasts, and articles to view, listen, or read about. Each one has a connection to the introductory unit in economics, whether it's through scarcity, economic systems, opportunity costs, demand, supply, or efficiency. I post the PDF in Google Classroom for students to click on the links of the document, and then write or type into the PDF with their IPADS.This is a great activity to do on a Friday during the first unit of Economic
Grades:
11th - 12th
Types:
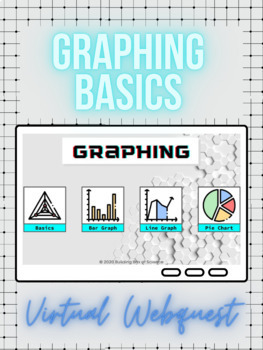
Graphing Basics Self-Guided Webquest
Introduce the Basics of Graphing with this Virtual Science WebQuest ideal for the beginning of the year! Students can answer the questions within their own copy of the presentation or they can complete the PDF Worksheet while viewing the Slides in Present Mode. This assignment is a great way to teach students how and when to use a bar graph, line graph, or pie chart. It can be taught face-to-face as review or assigned in Google Classroom as a sub lesson. This Interactive Assignment covers:⚗️ Bas
Subjects:
Grades:
5th - 10th
Also included in: South Carolina 7th Grade Science CUSTOM Activity Bundle (3)

Cinco de Mayo Webquest - NO PREP - Editable in Google Slides!
I use this WebQuest in my 6th grade Computer Tech class and the students thoroughly enjoy it. There are many misconceptions associated with Cinco de Mayo; this WebQuest addresses some of those misconceptions, as well as enhances strategies for research while also focusing on typing skills at the same time. There are 3 parts included in the webquest. Background KnowledgeResearch WordCloudThe answer key is also included for part 2 of the research.
Grades:
4th - 7th
Types:
CCSS:
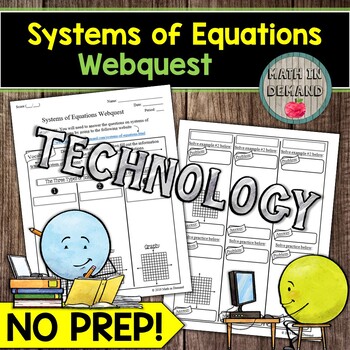
Systems of Equations Webquest Math
Students will need a device for my math webquest on systems of equations. Students will be given a link that goes to my website containing information about the number of solutions (no solution, one solution, and infinitely many solutions), and how to determine the number of solutions by using graphing, substitution, and elimination. I have included a worksheet that aligns to the information on my website. All you need to do is print and go! In addition, there is a 10 problem quiz on my website.
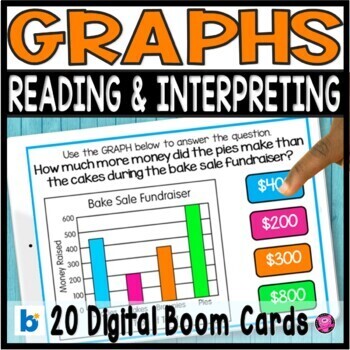
Bar Graphs and Picture Graphs Reading & Analyzing Data Digital Boom Cards
Teaching second and third grade students how to read and interpret data, solve one- and two-step "how many more" and "how many less" problems using information presented in scaled bar graphs will be fun and engaging using these 20 DIGITAL Boom math tasks! Students will practice common core 3.MD.B.3 graphing activities using multiple representations of graphs including data tables, bar graphs, line graphs, and pie graphs. The questions are differentiated for a wide range of learners.Click here to
Subjects:
Grades:
2nd - 3rd
Types:
Also included in: Graphing and Date Analysis Reading and Interpreting Graphs and Data
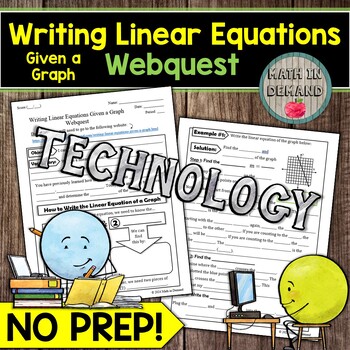
Writing Linear Equations Given a Graph Webquest
Students will need a device for my math webquest on writing linear equations given a graph. Students will be given a link that goes to my website containing information about how to write the linear equation of a graph. Students will learn how to: (1) determine the slope of a graph, (2) find the y-intercept of a graph, and (3) write the equation of the linear graph using the slope-intercept form equation. I have included a worksheet that aligns to the information on my website. All you need to d
Grades:
8th
Types:

Webquest Investigation - Slope of a Line
Using a free online graphing calculator, students explore relationships between linear equations, their graphs, and the slopes of the lines. By the end of this investigation, students will discover relationships between parallel lines, perpendicular lines, and their slopes. Enjoy!
Subjects:
Grades:
7th - 11th, Adult Education
Types:

Stem Cell WebQuest
Students use the internet to research stem cells using a guided research worksheet. Helpful website are provided, but it is encouraged that students practice their research skills to complete the WebQuest. Use this activity to introduce stem cells or to enhance your stem cell lesson. This makes for a perfect alternative to taking notes and provides and opportunity to have a discussion on the use of stem cells.Included:Student WebQuest (PDF and Word Document)Student WebQuest International Baccala
Subjects:
Grades:
9th - 12th
Types:
Also included in: Labs and Activities for a Year of Biology

Coordinate Plane Escape Room | Graphing Digital Breakout
Make your Coordinate Plane lessons more fun with with this engaging, digital escape room! This escape room includes 9 critical thinking and puzzle locks perfect for sharpening research skills and a never give up attitude. Quick and easy setup plus clear student directions make this activity perfect for individuals, groups, or even substitute days, too! Did I mention that this breakout is editable?!? Use as is, add, or subtract questions and then post the link through Google Classroom, a class w
Subjects:
Grades:
5th - 8th
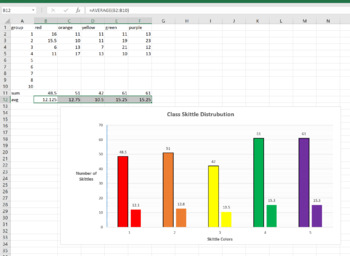
Skittle Statistics MS Excel Mini-Lab
This is a 1 class MS Excel lab for a computer or math class. You can have the students explore the distribution of different color Skittles in class. This is a great mini-lab or half-day activity when you school ends up with a weird schedule day. Tell them they can't eat till the Skittles till the end of class, or they will distort their numbers. Also make sure they don't throw them or shove them up their nose (Yes, stuck Skittles are hard to extract, ask me how I know..)The goal of this lab is
Grades:
6th - 12th, Higher Education, Adult Education
Types:
NGSS:
MS-ETS1-2
, HS-ETS1-2
, HS-ETS1-3
, MS-ETS1-4
, MS-ETS1-1
...
Also included in: Hands-on Science Semester Labs Bundle
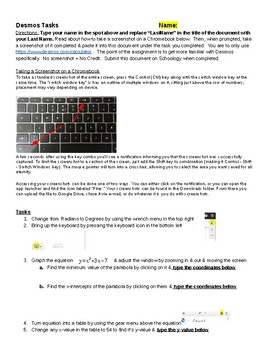
CAASPP Desmos Practice Tasks
The CAASPP test that our students take is a computer adaptive test that uses the Desmos Calculator (on problems that allow a calc). If your students do not use Desmos beforehand, they will be at a disadvantage. I put together these tasks to walk students through the various functions Desmos can complete. Students answer some questions & take some Screenshots to show the teacher they can now use Desmos. This activity is designed to be completed on a Chromebook or something similar. It is
Subjects:
Grades:
6th - 12th
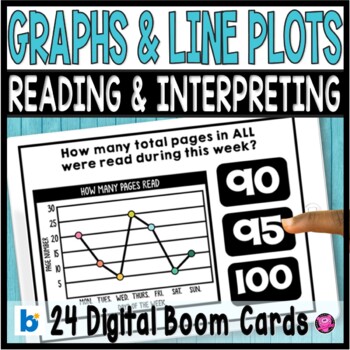
Graphing and Data - Bar Graphs Line Plots Pictographs 3rd Grade DIGITAL Tasks
Teaching your 3rd and 4th grade students how to read, interpret, and analyze dat data using bar graphs, line plots, and picture graphs will simple and easy using these 24 DIGITAL math tasks. Students will practice answering questions like: "how many more", "how many less", and "compare data" using line plots and pictographs. Boom Card can be used with Google Classroom, SeeSaw, ClassDoJo and other platforms. Click here to SAVE 20% on my Graphing Bundle!PLEASE NOTE YOU ARE PURCHASING A LINK TO ACC
Subjects:
Grades:
1st - 3rd
Types:
Also included in: Graphing and Date Analysis Reading and Interpreting Graphs and Data

Misleading Graph WebQuest
This editable Google Doc contains 10 questions and is to be used with the following website:5 Ways Writers Use Misleading Graphs To Manipulate YouI also recommend starting the lesson by showing the following YouTube videos:How to spot a misleading graphHow statistics can be misleading
Subjects:
Grades:
6th - 12th
CCSS:
Position vs. Time Graphs: Grasshopper vs. Snail Interactive + Worksheet
This worksheet compliments the free online Virtual Science Teachers Position vs. Time Graphs: Snail vs. Grasshopper interactive. The provided printable graphic can be used in place of using the online interactive.Note: Test out the free part of the activity by clicking on this link. Be sure it works in the classroom and is not blocked by your school district.Students fill out the printed worksheet as they work through the interactive. Please note that the worksheet includes many questions tha
Subjects:
Grades:
5th - 10th
Types:

Inside Out and Back Again - Cultural and Historical Context Webquest
In this editable webquest, students will learn about Vietnamese culture and the history of the Vietnam War as it relates to the book Inside Out and Back Again. Language in the resource and suggested resources below is suitable for EAL students!There are many resources available for students to find this information, but I used the following:Inside Out And Back Again: Background The Main Facts About The Vietnam War The Vietnam War and its effect on Vietnamese Refugees Students can stop reading af
Grades:
5th - 8th
Types:
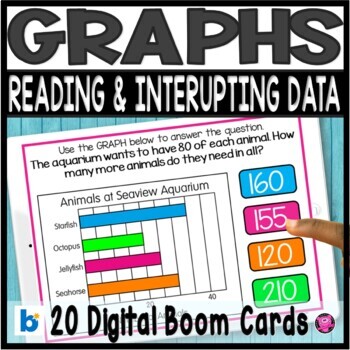
Reading and Interpreting Graphs DIGITAL Task Cards | Graphing
Do your students need teaching and practice activities for reading and interpreting horizontal and vertical bar graphs? This is a set of 20 DIGITAL Boom task cards for students to practice reading and interpreting HORIZONTAL and VERTICAL bar graphs with increments of 5. Students will answer questions like: "how many more", "how many less", and "compare data" about Aquarium Animals. Great for math centers/stations, whole group teaching, small groups, and even assessments! Boom Card can be used wi
Subjects:
Grades:
1st - 4th
Types:
Also included in: Graphing and Date Analysis Reading and Interpreting Graphs and Data
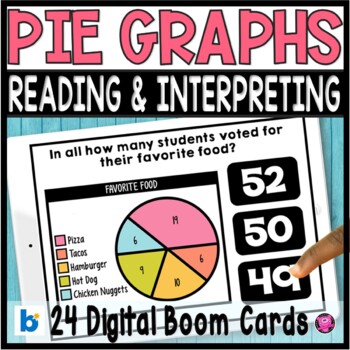
Pie Graphs Interpreting and Reading Data - Digital Boom Cards Pie Graphs
Teaching students how to read and interpret data, solve one- and two-step "how many more" and "how many less" problems using information presented in scaled bar graphs and pie graphs will be fun and engaging using these 24 DIGITAL Boom math tasks! Students will practice common core 3.MD.B.3 graphing activities using multiple representations of graphs including data tables, bar graphs, line graphs, and pie graphs. The questions are differentiated for a wide range of learnersClick here to SAVE 20%
Subjects:
Grades:
1st - 3rd
Types:
Also included in: Graphing and Date Analysis Reading and Interpreting Graphs and Data

Lipids Webquest- Macromolecule Investigations. Editable
Students investigate the properties of lipids through this webquest. Students research information about unsaturated, saturated, and transfats to determine their health values and chemical shapes. Students also research fad diets and form an opinion on fad diets and nutrition. Included:Student WebquestTeacher KeyTeacher instructionsSuggested websitesSuggested follow up or preview videosThis activity is perfect for during a macro molecule unit during distance learning or in class learning!
Grades:
9th - 12th
Types:
Also included in: Labs and Activities for a Year of Biology

Economics: Supply and Demand: Video Case Study Notes
This product is a graphic organizer for students to write on as they watch a great 45 minute YouTube video called Investigating rising food prices about why the price of rice increased in Thailand. It forces them to note details, statistics, but more importantly to think critically about course connections and potential implications of the video.The graphic organizer is one page and has students keep track of: statistics they hear in the video, connections they make to the course (specific vocab
Grades:
11th - 12th

Virtual Heating ICE Lab, Graphing, NO PREP
Ready-to-Go Lesson on Graphing Temperature DataThis worksheet is designed to accompany the Virtual Science Teachers Heating Ice Lab as a guided practice for collecting, graphing, and analyzing data. If your students have access to computers, then this lesson is all ready to go! Just provide students the worksheet and a link to the interactive. Students record and graph the temperature measurements as the simulated beaker of ice melts and eventually boils. Students then use their graph to answe
Subjects:
Grades:
5th - 9th
Types:
NGSS:
MS-PS1-4
, MS-PS1-2
Showing 1-24 of 49 results

