192 results
Graphing workbooks under $5
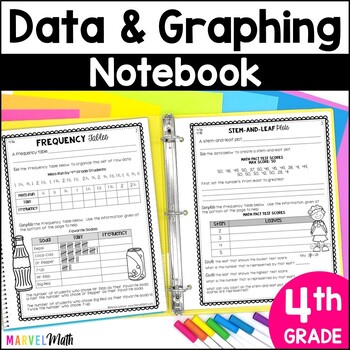
4th Grade TEKS Dot Plots, Stem and Leaf Plots, Graphs, Data Analysis Notebook
This no prep Data Analysis and Graphs notebook thoroughly covers the 4th grade Data Analysis and TEKS: 4.9A & 4.9B. Simply print and hole punch and this notebook is ready for you to teach dot plots, stem-and-leaf plots and frequency tables. Use the pages for whole class or small group guided math lessons while also helping students build their own reference tool.This is a TEKS centered resource. While others may be “TEKS-aligned,” they often cover Common Core standards as well. My Texas
Subjects:
Grades:
4th
Also included in: Math Interactive Notebook 4th Grade - TEKS Bundle
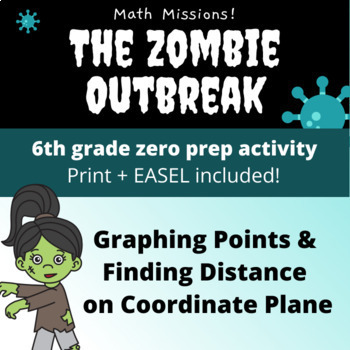
Coordinate Plane Graphing & Distance | Plotting Points, Quadrants | 6th Grade
Looking for an exciting application for plotting points coordinate planes, identifying quadrants, and calculating distance on graphs? How about a zombie apocalypse? In this print-and-go, EASEL-compatible activity, students must help the CDC stop an outbreak by plotting outbreak locations, analyzing where to place a laboratory and hospital, and computing the distance between infected individuals.What's included?Your purchase includes two formats of the same activity:Print PDF. Print and manually
Subjects:
Grades:
6th
Types:
CCSS:
Also included in: Geometry Activity BUNDLE | 6th Grade Math | Surface Area, Volume, Nets
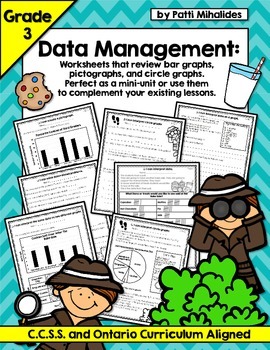
Graphing/Data Management Third Grade Worksheets (bar, circle, pictographs)
This is a ten-page collection of Math worksheets that covers the following: • comparing the same data on a bar graph and pictograph• writing about what one interprets from a graph (students are encouraged to consider the data on a higher level) • transferring data from a bar graph to a pictograph (two opportunities to practice this, one more challenging than the other) • solve data related problems using addition and subtraction • respond to higher level thinking, open-ended questions (e.g. Why
Grades:
2nd - 4th
Types:
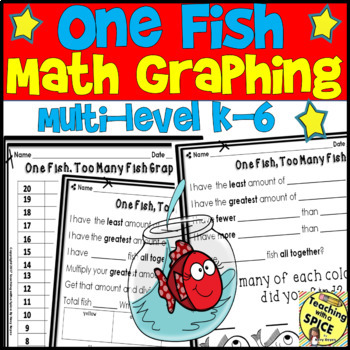
RHYME TIME Week Graphing fish / Math / Distance Learning / Read Across America
RHYME TIME One Fish, Too Many Fish Goldfish Graphing is designed for multi-level K-6! It is easy enough for Kindergarten and great enough for higher grades with fractions included. 12 PAGES TOTAL PACKET SEE PREVIEW FOR DEALS!!!★RHYME TIME Multiplication Color by Number Skunk with a Hat★RHYME TIME Equivalent Fractions Color by Number Skunk with a Hat★RHYME TIME Equivalent Fractions Color by Number Mustached Man★Multiplication Color By Number★RHYME TIME ELA and MATH HUGE PACKET!!!!!!!! 80+pages★
Subjects:
Grades:
PreK - 6th
Types:
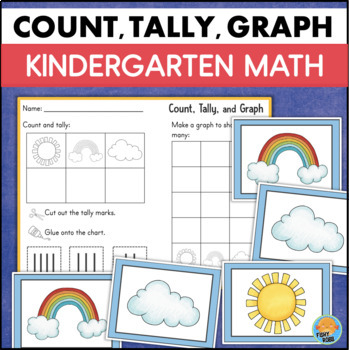
Kindergarten Counting Objects to 5 Sorting Creating Simple Graphs Tally Marks
This is a set of sorting, counting, and graphing activities for kindergarten. It's a great way to introduce young learners to the concept of data collection.These activities involve matching, sorting, counting sets of objects, representing numbers, cutting and pasting.INCLUDES:5 different sets of sorting/counting cards (total of 50 cards)5 graphing worksheetsAnswer keysDigital activitiesAfter giving students a set of cards to work with, they will:sort the cardscount how many there are of each ob
Grades:
K
Types:
CCSS:
Also included in: Kindergarten Math BUNDLE Ways to Show A Number ID Counting Objects to 10
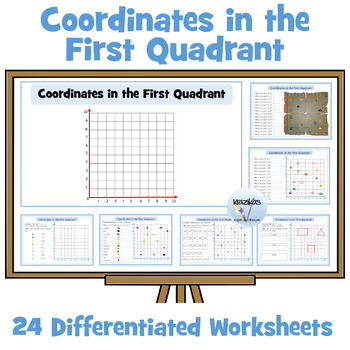
Coordinates in the First Quadrant Worksheets
This resource contains a 24 page workbook / 24 differentiated worksheets on coordinates in the first quadrant. Answers are provided.Tasks include:locating coordinatesplotting coordinatesfinding missing coordinatesYou may also be interested in:Coordinates in the First Quadrant PowerPoint LessonThis is an accompanying highly visual and interactive 50-slide PowerPoint lesson on coordinates in the first quadrant. The PowerPoint clearly explains and visually demonstrates the following:gridsx and y ax
Grades:
4th - 8th
Types:
Also included in: Coordinates in the First Quadrant
Making Science Charts and Graphs
A simplified look at making charts and organizing data in science.
-Data Charts
-Circle Graphs
-Bar Graphs
-Line Graphs
-Key Vocabulary List
-Quiz/Assessment
-Activity - Practice
-Teacher answer key for quiz and activity
Thanks for taking the time to stop by my store!
Mrs. Degs
Teaching Science Well
Blog: http://teachingsciencewell.wordpress.com/
Facebook: https://www.facebook.com/TeachingScienceWell
TPT: http://www.teacherspayteachers.com/Store/Teaching-Science-Well-Science-Resources
Pi
Subjects:
Grades:
3rd - 10th
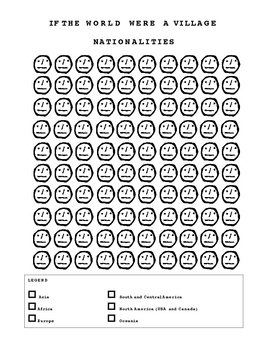
If The World Were a Village Student Workbook Printable
A great package designed to integrate Math, Social Studies, and Language Arts instruction to supplement reading the children's book If the World Were a Village. Each class, we read 1-2 pages from the book If the World Were A Village which narrows the world population down to a village of 100 people and examines nationalities, languages, religions, ages, wealth, food and water, electricity and much more. I soon decided to use the reading to teach students about data management, interpretation and
Grades:
3rd - 8th
Types:
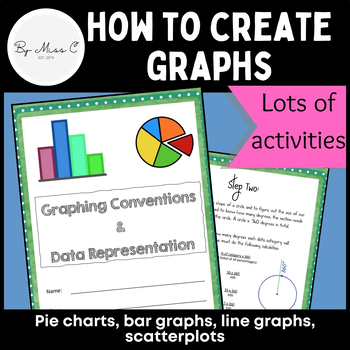
Guide to graphs: Pie charts, bar graphs, line graphs, scatterplots + activities
This is a fantastic resource for introducing students to graphing and data representation. This booklet will take students through the uses for particular graphs and how to construct them. At the end of each module, there are activities for students to complete, to practice their graphing skills. Answer key is included, making this a no-prep activity. This booklet covers: - why we visually represent data- pie charts and how to create them - bar graphs and how to create them - line graphs and how
Subjects:
Grades:
6th - 12th, Higher Education, Adult Education
Types:
CCSS:
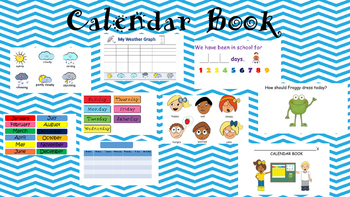
Adaptive and Interactive Calendar Book
This calendar book is a great resource for students who need hands-on material to master calendar skills. It provides visual and tactile reinforcement of skills such as; day of the week, date, holiday, month, weather, and more. There are also pages for graphing, dressing a frog appropriately for the weather, and describing feelings.
In addition, I have included a larger weather frog (with accessories) to be used as a visual. I have also included a hundred chart and alphabet chart, in case
Subjects:
Grades:
PreK - 5th
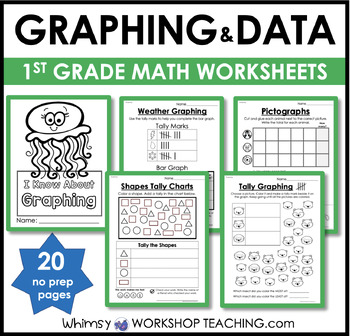
1st Grade Math NO PREP Graphing Data Worksheets Activities
This packet is packed with no prep worksheets for practicing 1st Grade graphing and data! It includes 20 engaging worksheets for first grade, including differentiated options so that all students can feel successful without being overwhelmed. These activities are perfect for math centers, whole group lessons, small group lessons, home practice, fast finishers, or review!Click the preview to view pages that are included in this packet!You can grab the First Grade Math FULL YEAR BUNDLE (includes a
Grades:
K - 2nd
Types:
Math Word Problem of the Day Grade 3 (Weeks 1-5)
Daily Word Problems Packet for Third Grade!
This packet includes 5 weeks of Daily Word Problems for third grade students and includes an answer key for the teacher in the back.
Popular Subjects within this packet:
- Addition and Subtraction
- Basic Multiplication
- Place Value
- Graphing
** Weeks 6-10 are coming out in a few weeks! **
Subjects:
Grades:
3rd
Types:
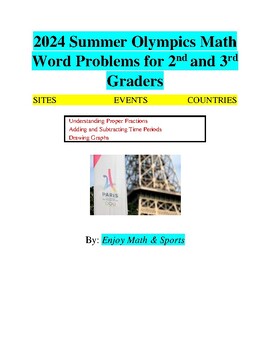
2024 Summer Olympics Word Problems for 2nd and 3rd Graders
Numerous subjects taught in Mathematics are widely used throughout the world of sports. This workbook presents word problems that show examples of 2nd and 3rd Grade mathematics subjects that are relevant to the 2024 Summer Olympics. The following subjects are covered:· Understanding Proper Fractions· Adding and Subtracting Time Periods· Drawing GraphsThe product presents introductory materials, 14 detailed examples, and 14 word- problems that cover these subjects. These pages are then followed b
Subjects:
Grades:
2nd - 5th
Types:
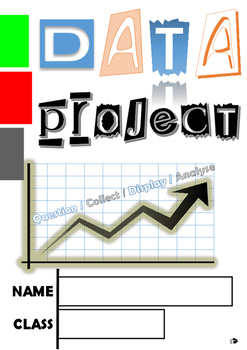
Data Project - Data representation and interpretation
This booklet walks students through the stages of data investigations:
STAGE 1: Deciding on a topic and posing a question
STAGE 2: Collecting raw data
STAGE 3: Graph or Display
STAGE 4: Analyse and Interpret
STAGE 5: Draw conclusion, reflect
The booklet has clear explanations at appropriate stages to support students in the more technical maths such as finding averages.
IF YOU LIKE THIS RESOURCE - PLEASE RATE
Subjects:
Grades:
3rd - 8th
Types:
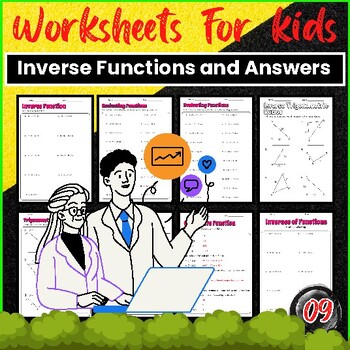
Inverse Functions Worksheet and Answers
In need of practicing your skills with inverse functions? Look no further than our comprehensive Inverse Functions Worksheet and Answers. This worksheet is designed for individuals who have a basic understanding of inverse functions and are looking to enhance their knowledge and mastery of this topic. With a range of thought-provoking questions and detailed solutions, this worksheet is the perfect resource to help you grasp the concept of inverse functions with ease and confidence.Table : Inv
Subjects:
Grades:
8th - 10th
Types:
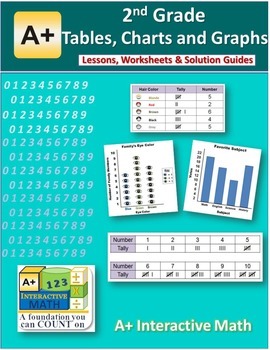
2nd Grade Tables, Charts and Graphs Lessons, Worksheets, Solution Manuals
Builds a Strong Foundation in Math! This book includes fun, colorful and engaging lessons, worksheets and worksheets solution guides. The lessons are easy to understand and teach math concepts with colorful visuals and text. Worksheet for each lesson provides practice in problem solving to master the math concepts. The solution guide for each worksheet provides solution steps with appropriate graphics to further clarify and reinforce math concepts.
The lessons covered in this book are:
Intr
Subjects:
Grades:
1st - 3rd
Types:
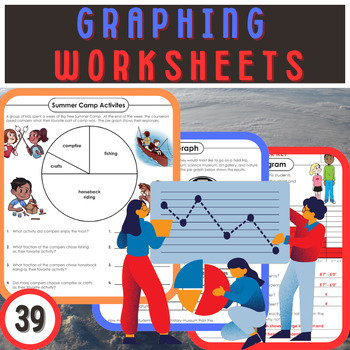
Graphing Mastery: Comprehensive Worksheets for All Types of Graphs!
Unlock the power of visual data representation with our "Graphing Mastery" worksheets, designed for a wide range of grades and abilities. These comprehensive resources cover every major type of graph, providing your students with the skills they need to read, create, and interpret data visually.From the basics of bar graphs to the intricacies of box-and-whisker plots, these worksheets offer a hands-on approach to understanding different graphing techniques. Here’s what you’ll find:Bar Graph Work
Subjects:
Grades:
K - 6th
Types:
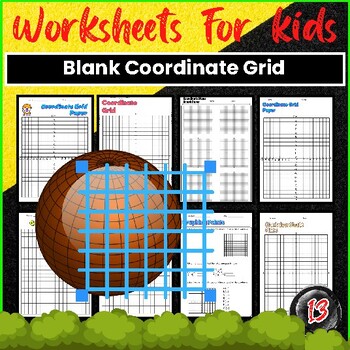
Blank Coordinate Grid Worksheets
Coordinate grids are essential tools for practicing math skills and understanding spatial relationships. Whether you're a teacher looking for extra resources or a student wanting additional practice, blank coordinate grid worksheets are a great way to strengthen your understanding of plotting points and graphing equations. This worksheet provides a coordinate grid graph that makes it easy for students to plot points. So, students don't need to create their own graphs because they need to print t
Subjects:
Grades:
3rd - 6th
Types:
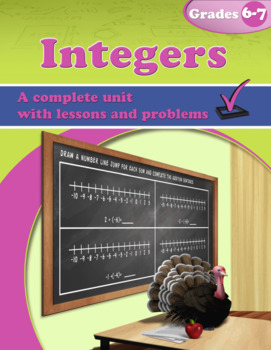
Integers (Distance Learning)
The unit Integers covers all the important integer topics for middle school (grades 6-8), with instructions written directly to the student, so it requires very little teacher involvement.Integers are introduced using the number line to relate them to the concepts of temperature, elevation, and money. We also study briefly the ideas of absolute value (an integer’s distance from zero) and the opposite of a number.Adding and subtracting integers is presented through two main models: (1) movements
Subjects:
Grades:
6th - 7th
Types:
Also included in: 7th Grade Math Units Bundle (Distance Learning)
Weather Workbook {Common Core Aligned} Graphing and Data Analysis
This is a NO PREP Weather Workbook for the whole school year. This Common Core resource file has dates inserted for the 2021-2022 school year. Just come back next summer and re-download to get next year's dates for free!The Weather Workbook includes the following concepts:daily weather trackinggraphing daily weather data (bar graphs)graphing daily/weekly/monthly temperature data (line graphs)data analysis (most/least and comparing two data points)personal connections to the data- illustrations
Subjects:
Grades:
K - 3rd
CCSS:
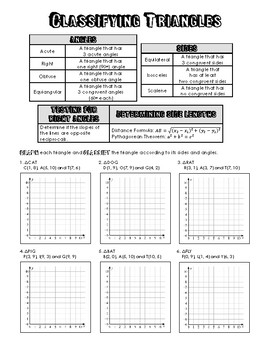
Classifying Triangles in a Coordinate Plane
Classifying Triangles in a Coordinate Plane
Grades:
7th - 12th
Types:
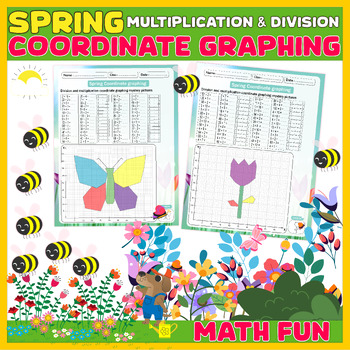
Spring Math Activities | Coordinate Graphing Mystery Pictures Worksheets
Dive into spring with our captivating Spring Math Worksheets! These engaging resources blend the excitement of mystery pictures with essential multiplication and division practice, making learning a thrilling adventure for your students. Each worksheet features a unique mystery picture that students reveal as they correctly solve the math problems, adding an element of surprise and fun to their learning journey. Perfect for reinforcing math skills in a delightful spring-themed context, these wor
Grades:
3rd - 7th
Types:
Eureka Math Grade 1 Module 3 Application Problem Journal
This is a student math journal for Eureka Math Application Problems (Module 3) in Grade 1. Each application problem has its own page with the lesson number clearly stated at the top of the page with room provided to solve each problem accordingly. A cover page comes included with all the application problems for Module 3.
Subjects:
Grades:
1st

Coordinate Graphing - GraphX - Mascot Bundle #2
Dr. Sigma's World Of Mathematics Mascots #2 is a compilation workbook of mathematics worksheets that can be used by all levels of mathematics (upper elementary through high school). These worksheets involve solving problems and then plotting the answers as points which, once they are connected, form pictures. Included in this workbook are coordinate graphing exercises that make pictures of a devil, a pirate, a mustang and a bandit.Would you like to receive updates and information about new produ
Grades:
4th - 12th
Types:
Showing 1-24 of 192 results


