80 results
Graphing research under $5
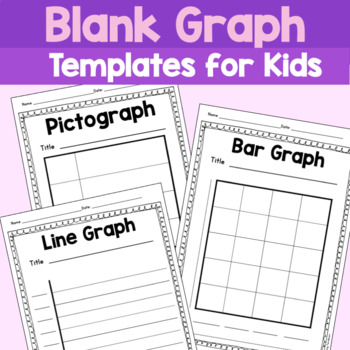
Blank Graph Templates: Bar Graph, Pictograph, Line Graph,
Blank Graph Templates: This resource includes 11 blank graph templates: blank Bar Graph template (3 versions, Pictograph template 3 Versions), blank Line Graph template (4 versions).
Subjects:
Grades:
K - 4th
Types:
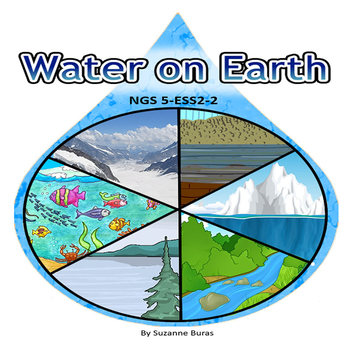
NGS 5-ESS2-2 Water on Earth
This product provides supplemental resources that address concepts related to describing and graphing the amounts and percentages of water and fresh water in various reservoirs to provide evidence about the distribution of water on Earth.The product includes the breakdown by percentages of the categories of water found on earth. It further breaks down each category into subcategories. For each, students are asked to graph the percentages. There is also a research opportunity related to drink
Subjects:
Grades:
4th - 6th
Types:
NGSS:
5-ESS2-2
Also included in: Next Generation Science: Earth Science Bundle 5-ESS1-3

Algebra Marketing Plan PBL | project based learning | real world Math
This Project Based Learning activity will help Algebra 1 students practice setting up and solving systems of linear equations within a real world context. As they take on the role of an entrepreneur, they will write equations, plot coordinate points, graph equations, analyze data, and draw conclusions. This can be used as a group project or individual project and would work great for an end of unit review. ------------------------------------------------------------------------------------------
Subjects:
Grades:
7th - 12th
CCSS:
Also included in: Math Algebra 1 BUNDLE projects, activities, notes, and more
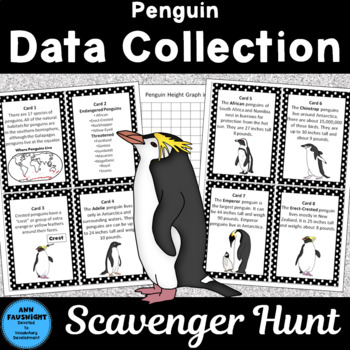
Penguin Scavenger Hunt with data collection and graphs
This scavenger hunt presents facts and fun information about the various penguins species. Students will collect data and complete graphs related to penguins. A Compare/Contrast matrix comparing flightless birds is provided for additional student research.1. Print the Penguins Scavenger Hunt cards on card stock or brightly-colored paper and cut them apart along the dotted lines. 2. Make copies of Penguins Scavenger Hunt data collection sheet. Each student needs a copy. 3. Place the Penguins Sca
Grades:
3rd - 5th
Types:
Also included in: Science Scavenger Hunts Bundle
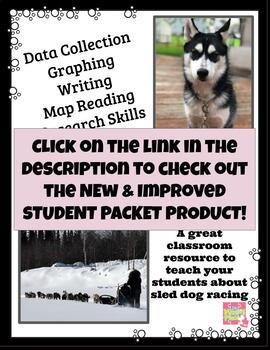
Iditarod Student Packet - Daily Tracking (Data Collection, Map Skills, Research)
Iditarod Student Packet - Daily Tracking (Data Collection, Map Skills, Research)This is the page for the previous OLDER version. If you purchase this product you are buying an older version.Click on the link below to be directed to the NEWER, UPDATED, EDITABLE version of this product:https://www.teacherspayteachers.com/Product/Iditarod-Student-PktDaily-Tracking-UPDATE-Data-CollectionMap-SkillsResearch-9140503This is a great resource for students who are interested in learning more about The Last
Subjects:
Grades:
3rd - 7th
Types:
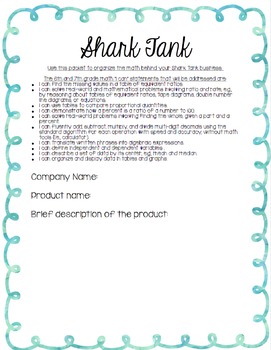
Shark Tank Project
Based on the hit show Shark Tank, students will create a product and business plan to pitch to the "Sharks". This product comes complete with the student packet, certificate for students, questions/script for the sharks, and teacher hints for how to make this a hit!All tasks within the project are connected to 6th and 7th grade CCSS math standards. "I Can" statements are provided in the student packet.Students will:-Create a company name and product-Determine the cost per product to make-Determi
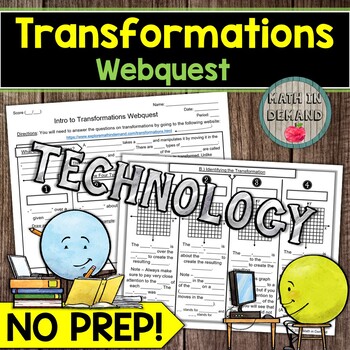
Transformations Webquest Reflection Rotation Translation Dilation
Students will need a device for my math webquest on transformations. Students will be given a link that goes to my website containing information about reflections, rotations, translations, and dilations. Students will learn how to: (1) identify a transformation, (2) perform a transformation, and (3) use the transformation rules to give the coordinates of an image. I have included a worksheet that aligns to the information on my website. All you need to do is print and go! In addition, there is
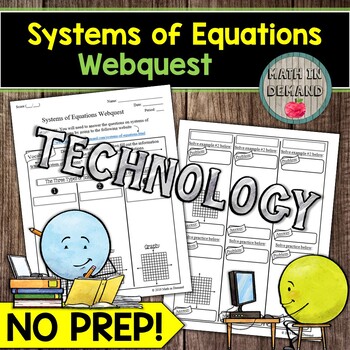
Systems of Equations Webquest Math
Students will need a device for my math webquest on systems of equations. Students will be given a link that goes to my website containing information about the number of solutions (no solution, one solution, and infinitely many solutions), and how to determine the number of solutions by using graphing, substitution, and elimination. I have included a worksheet that aligns to the information on my website. All you need to do is print and go! In addition, there is a 10 problem quiz on my website.
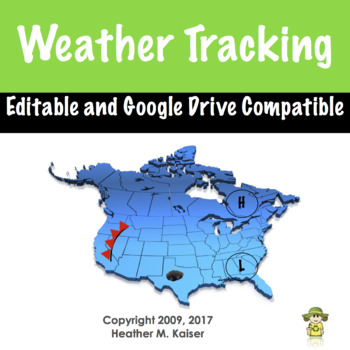
Weather Tracking in Excel
Compatible with Google Sheets, Google Classroom, or as a stand-alone file on a PC, this product is a must have for any teacher comparing weather conditions in multiple locations!
BEFORE YOU BUY: This file is part of a larger unit. Save yourself money by purchasing the Super Science Set for Weather and Climate nstead of buying each file separately.
Purchased alone, you get:
⭐ An Excel workbook that enables students to track the weather for 5 different locations as a whole class or individ
Subjects:
Grades:
4th - 8th
Types:
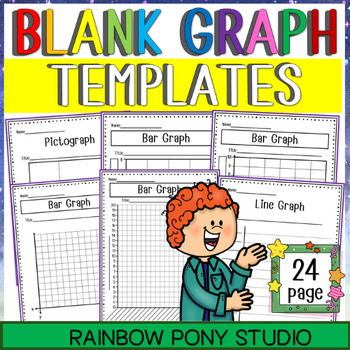
Blank Bar Graph Template | Bar Graph, Pictograph, Line Graph,
Resource to help students graph their own data using a bar graph, line graph, or pictograph. These blank graphs are a great data collection tool.Bar GraphsLine GraphsPictographsYOU MAY ALSO LIKE:Free Click HearSave The BundlesAll About My Mom | My Mom Printable Filp BookFirefighter Appreciation Coloring Pages and Card Thank YouCinco de Mayo CraftTesting Motivation CardsAll about my TEACHER Questionnaire Survey Week ColoringTeacher appreciation week questionnaire | Teachers Favorite Things Questi
Subjects:
Grades:
K - 4th
Types:
Superbowl Statistics, Graphing Project with Writing Prompt 3-5
****NEWLY UPDATED*****
This project has students selecting a team that will win the Superbowl, then using statistics from the season and graphing to PROVE their team will win. The document lists requirements, types of graphs and ideas for ways to show data with the team's season statistics. Teachers/students will need to go to the NFL website and research the statistics. Teachers could also print these off for teams to use.
The second half of the project has been added in support of CCSS. Stude
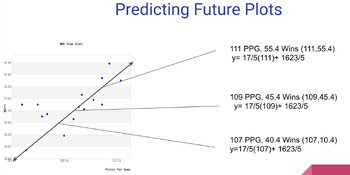
Scatter Plot Project on Desmos with Template
Learners will work to collect their own data from something they are interested in. They will then create a scatter plot using Desmos.com and analyze the information they collected. The analysis includes drawing their own trend line, finding the equation of that trend line, and predicting 3 values outside their original data collection. There are detailed directions with screenshots included along with a Google Slides template that can be shared with learners to help them organize their work. I
Subjects:
Grades:
7th - 9th
Types:
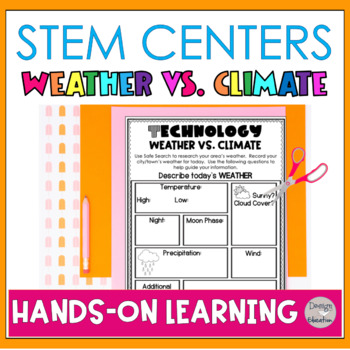
STEM Centers Weather and Climate | STEM Stations Science Concepts
Make teaching weather and climate fun with these engaging, hands-on STEM centers! This set includes 4 low-prep STEM stations perfect for exploring weather/climate skills and critical thinking. Quick and easy setup plus clear directions make these activities perfect for centers, extensions, or entire unit teaching! Lead your students to discover concepts of climate and weather by exploring it on their own. Students will love researching science concepts through these fun STEM activities, and won'

Create Your Own City/Town with a Coordinate Plane
Finish your unit on coordinate planes with a project! Using only quadrant 1, students will learn all about map making, graphing points on a coordinate plane, and creating questions based on points on the coordinate plane. Included are:-A PowerPoint embedded with videos, notes, and directions for the project-A packet is linked on the first slide with directions, rough draft paper, worksheets, final copy paper, and a rubric!Use this interdisciplinary project today to better students' understanding

Facts About Endangered Species - Bar Graph and Data Analysis
Complete independent study and activity to bring awareness to endangered species. Students get introduced to the Endangered Species Act, answer questions, create a graph based on data provided, and prepare a PowerPoint presentation on a species of their choice. This is a complete activity where students are engaged and practice their analysis and graphing skills. They take ownership of their work by selecting the subject of their research and presenting their report to the group. This is a ve
Subjects:
Grades:
5th - 8th
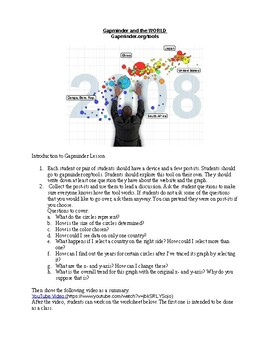
Gapminder and the World Activity
Students use gapminder.org/tools to discover the relationships between various historical factors and the population of many countries over time. This lesson connects history with linear relationships. It is a great way to add context to graphs and help students apply their math knowledge in a unique cross-content way.
Subjects:
Grades:
8th - 12th
Types:
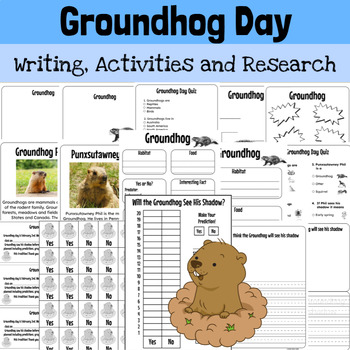
Groundhog day activities predictions research project kindergarten 1st preschool
Groundhog day activity for kindergarten, first, second grade. Includes home letter, predictions, voting, writing, graphing, research project, quiz, graphic organizers, labeling, non-fiction articles and more! Differentiation included! This resource was designed to be used for a variety of grade levels and ability levels, so for some activities (quiz, research project) you have the flexibility to choose which resources will work best with your group of students! Or mix and match to meet all of yo
Grades:
PreK - 3rd
Types:
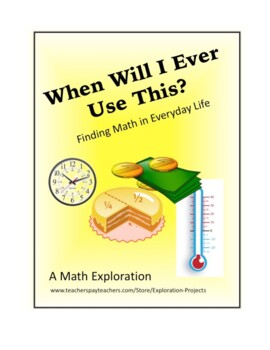
Math- When Will I Ever Use This? Finding Math in Everyday Life
Research and record how you and others use math every day. You will conduct a survey, analyze your data, and create graphs. You will begin to appreciate how math is embedded in many aspects of our lives.This math Exploration includes detailed, student-friendly Steps to Success that lead the learner through the process of creating a high-level, quality independent project. To add rigor and thoughtfulness, students reflect on their Exploration by answering standards-based Questions of Mathematical
Subjects:
Grades:
3rd - 8th
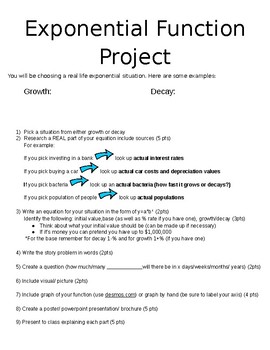
Exponential Function Real Life Project
Students pick an exponential growth or decay situation and research real life rates or values. Furthermore, they create an equation, write a story problem, ask and answer a question, create a graph and present a powerpoint or poster about their exponential situation.
* Note blank space under growth and decay is meant for a whole class brainstorm about the different scenarios they can think of.
Subjects:
Grades:
8th - 12th
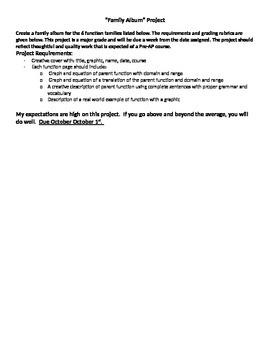
Family Album Project
A project designed to summarize the transformations, characteristics, and domain and range of the parent functions. Allows students to be creative.
Subjects:
Grades:
9th - 12th
Types:
CITY GRAPHING PROJECT
City. Cities Research. Graphing Analysis. Intercultural Awareness.The city graphing project serves two purposes. The written portion of the project helps to create intercultural awareness of different cities in the world and the graphing portion allows students to graph authentic data. Two sets of data are graphed with 2 different types of graphs and students critique in the conclusion which graph was best suited to display this type of data. Questions and a graphic organizer is included to
Subjects:
Grades:
5th - 8th
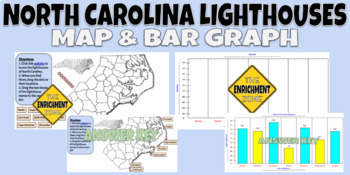
North Carolina Lighthouses Map and Bar Graph
North Carolina's lighthouses are some of the most famous in the world. There are 7 standing lighthouses along the coast of NC and many students may never see them in person. In this resource, students will be able to research where those lighthouses are and how tall they are. What's included:1. Blank map of NC coast and directions for students to go to a website and locate the lighthouses, then come back to the Google Slides and drag the circles/names to the correct location.2. Blank bar graph
Grades:
3rd - 12th
Types:
6 Editable Bar Graph Templates 2.0
Finally a simple and professional graph space that students can fill out without any design issues getting in the way. This file contains 6 ready-to-use graph options. Print them and have students fill them with pencil and ruler, or distribute them over computer and let them practice entering the data. Get a project perfect finish every time. Maybe you just want to fill it out live on a projector? The possibilities are endless! It's okay to say you love these bar graphs. So do we.Contains:- 2 bl
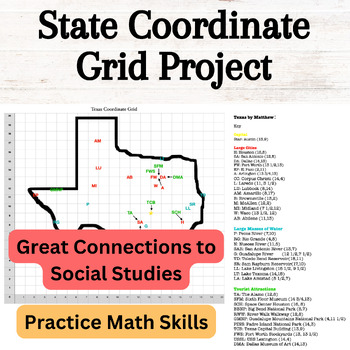
State Report Coordinate Grid Mapping Technology Project Research EDITABLE
This resource serves as an excellent tool for presenting state research reports and honing students' skills in math coordinate grids and mapping. I utilized this resource as a title or cover page for my students' state reports. It provides documents compatible with both PC and Apple computers, with Microsoft Word & Excel files for PCs and Pages & Numbers files for Apple computers. Every element is fully customizable to suit your classroom's specific needs.Here's how this resource works:1
Subjects:
Grades:
3rd - 6th
Types:
Showing 1-24 of 80 results


