60 results
Graphing simulations under $5
Line of Best Fit and Scatterplots
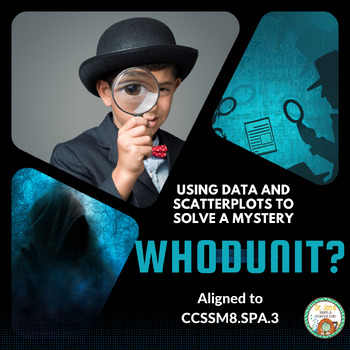
Who doesn't love a good mystery?!!!! In this engaging students use a real life scenario to apply scatterplot data of shoe size and height and the line of best fit to capture the correct suspect. This product has lots of great reviews! Many middle school math teachers state this was a great way to review the concept of line of best fit and scatterplots. Aligned to CCSSM8.SP.A.2 and CCSSM8.SP.A.3This activity is also available in a bundle at a discounted rate:Scatterplots and Line of Best
Subjects:
Grades:
7th - 9th
Types:
Also included in: Line of Best Fit and Scatterplots: The Bundle
Decimals Project based learning Monster Ice Cream Parlor
Welcome to The Monster Ice Cream Parlor Decimal focused project-based learning! In this student-tested and approved project, students jump into ownership of the monster ice cream parlor. They create flavors, set prices, and graph their sales all while practicing adding, subtracting and multiplying decimals, and graphing. Included in this ready to use project:- Student pages for building a monster ice cream parlor- Student pages for calculating revenue- Student pages for graphing revenue and s
Subjects:
Grades:
4th - 6th
Types:
Also included in: 6th grade math MEGA resource bundle
Line of Best Fit and Scatterplots: The Bundle
This bundle includes 2 engaging activities where students can apply the skills of plotting points in a scatterplot, making a line of best fit, and finding the slope of the line to find missing data. Fun scenarios of Sasquatch and a crime scene hook kids into learning. Please leave feedback, you can earn TpT credits for future purchases. If you enjoy these activities consider following my store as I work to increase my middle school math inventory. Check out my other middle school math produc
Subjects:
Grades:
7th - 9th
Types:
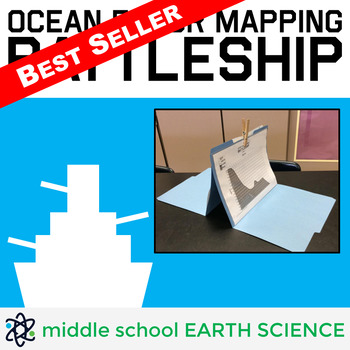
Ocean Floor Mapping Battleship Game
Teacher Review: "My students are obsessed with this activity! They even ask to play during indoor recess!" - Turner's Teaching Troop (January 22, 2020)Ocean Floor Mapping Battleship includes 36 unique maps of the ocean floor, a recording sheet, a detailed lesson plan with suggested pre-game activities, a blank map students can use to draw their own ocean floor, a diagram showing the layers of the ocean, and easy to follow game instructions. Field tested with sixth-graders, this game challenges s
Subjects:
Grades:
5th - 9th
Types:
CCSS:
Also included in: Earth Science Games Bundle
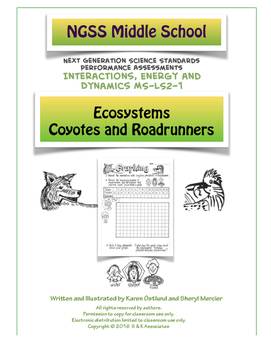
Ecosystems- Roadrunners and Coyotes NGSS Middle School LS2-1
Turn your students into an active ecosystem. This activity is similar to the classic Oh Deer simulation with a roadrunner and coyote twist. This sequence of NGSS aligned activities/assessments includes two simulation activities in which students are in the roles of a population of roadrunners, a predator (coyote), and resources (food, water, shelter). Students collect, graph, and analyze data to look for cause and effect relationships in an ecosystem. Reading and writing pages are included along
Subjects:
Grades:
5th - 7th
Types:
NGSS:
MS-LS2-1
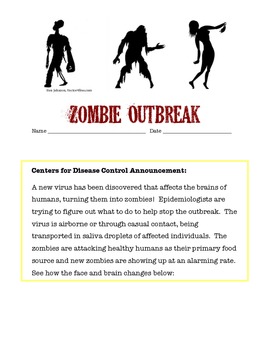
Investigating the Spread of a Viral Outbreak
Students in grades 5 - 9 model the spread of an infectious disease under the entertaining theme of a zombie outbreak. One student unknowingly is patient zero and students simulate the spread of an airborne illness. This highly engaging activity covers health topics, nature of science, and math skills as students graph data in a line plot. Higher level students can be challenged to find the function of the exponential growth of the outbreak.
Subjects:
Grades:
6th - 9th

Stock Market Simulation Challenge I Digital Learning
What better way to understand how the stock market works than to simulate it in your classroom? To make it a competitive project! This simulation contains the project worksheets, hyperlinks, research guides, and graphs needed for your students to "purchase" their own stock and track it's value over time. This project was written to accompany Gary Paulsen's book "Lawn Boy," but it can be used with or without this book.These activities are suitable for upper-elementary and middle grade students
Subjects:
Grades:
5th - 7th
Types:
Scatterplots and Line of Best Fit
This engaging activity allows students to apply their knowledge of slope, scatterplot data, and line of best fit to figure out how tall Sasquatch is. Taking the role of engineers, students use a foot print of sasquatch to approximate his height which is needed to construct a trap. An engaging newspaper article sets the scene of the recent Sasquatch sightings at the local park. This activity is also available in a bundle at a discounted rate:Scatterplots and Line of Best Fit BundleAligned to C
Subjects:
Grades:
7th - 9th
Types:
Also included in: Line of Best Fit and Scatterplots: The Bundle
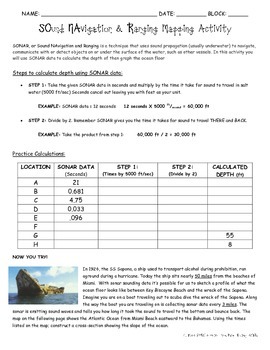
SONAR Calculations and Graphing
In this classroom activity, students are guided through the calculations necessary to obtain ocean depth from SONAR data. Then they use data to complete a profile of the part of ocean floor from which the data came. Please note: this does not show all the parts of the ocean floor. Image and activity where adapted from Naval History STEM H.
Subjects:
Grades:
6th - 12th
Types:
Project Based Learning: Starting a School Post Office
STEM Starting a School Post Office will introduce students to many important economics concepts as they start and run a School Post Office Simulation. Students learn how the post office runs and how their mail is delivered. This activity is a real live learning event! Students will love learning about economics as they start and run a post office!
Includes:
•Teachers Pages (4)
•Economic Concepts Page
•Student Objective Page
•Lesson Directions Pages (11)
•Pre-Assessment Prompt
•Design a Stam
Subjects:
Grades:
3rd - 5th
Types:
Also included in: Project Based Learning Bundle
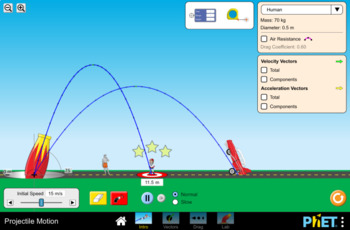
Projectile Motion Simulation Lab- PhET
This handout is meant to accompany the Projectile Motion simulation found here: https://phet.colorado.edu/en/simulation/projectile-motion
45 minute lesson time
This lab can be used to teach a range of concepts such as:
-Relationships between independent/manipulated and dependent/responding variables
-Forces in motion
-Projectile Motion
-The relationship between firing angle and distance traveled
-Graphing independent/ dependent variables
-Creating data tables
Subjects:
Grades:
6th - 12th, Higher Education, Adult Education
Types:
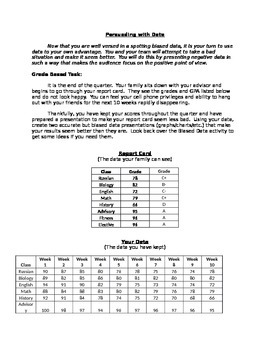
Persuading with Data: Using data bias to your advantage
The activity is designed as a follow-up to my Data Bias activity (posted for free). Student use what they learned about data bias to create data presentations (graphs, charts) that help prove their point. Multiple scenarios are given where students are trying to convince their parents that their grades/behavior aren't bad.
This activity helps students internalize the power of data bias and makes them more likely to look out for this bias in the real world. This makes for a really fun homew
Subjects:
Grades:
7th - 10th
Types:
Simulation Classroom Economy Lesson Plan
This lesson plan is for a fifth or possible sixth grade economics unit. The lesson is specially designed to be a part of an economics unit which requires or needs a simulation. The lesson plan includes critical questions, currency template, simulation record sheet and step-by-step instructions on how to set up your classroom. This lesson plan will make your classroom economy simulation meaningful, integrated, value based, challenging and active (MIVCA).
Subjects:
Grades:
4th - 12th, Higher Education
Types:
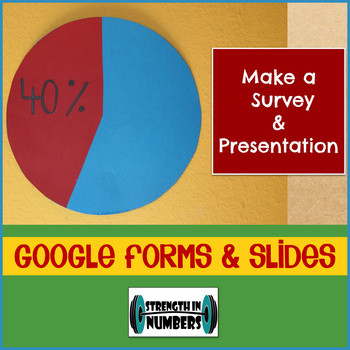
Teach Students to Make a Survey & Presentation with Google Forms & Slides
Show your students how to create a poll/survey using Google forms. This easy-to-follow slides presentation shows students how to make and customize a survey, make a QR code with a direct link to the survey, and use the results to make a presentation for the class using graphs from their data.
Subjects:
Grades:
5th - 12th
Types:
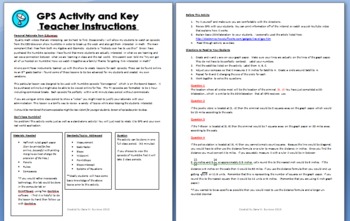
GPS Simulation - Applications of Algebra and Geometry - Aligned with Numb3rs
Are you tired of hearing your students say "When would you ever use this!?" This lesson is a perfect way to silence their complaints!
I originally designed this lesson to be used after watching the episode "Convergence"of the CBS television series Numb3rs. I think every middle/HS teacher should own copies of this series. If you aren't familiar with the show, it is basically a crime show where the characters solve crimes with math. (Similar to CSI) You might be able to download free episodes
Grades:
8th - 12th
Types:
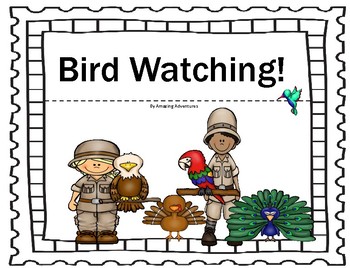
Bird Watching
After researching various birds, I created mini books. The art of bird watching is as simple as looking at all the identification markings on a particular bird. This can be a long lesson on birds or daily lessons on each individual bird. This includes information on birds' height and wingspan. I have made different booklets for you to use with your students, depending on their level. Students love to compare the birds. Pretending the birds are real, also captures their imagination. They
Subjects:
Grades:
PreK - 2nd
Types:
Stock Market Simulation Project, Grade 7 Math, PBL Extended Project
Everything you need to run a stock market simulation project with your class. I used this with grade 7 students, but could be used or modified for a range of grades. Students will learn what the stock market is and how it works, make their own informed stock purchases, and then make trades with each other to simulate the stock exchange in your classroom over several class periods. They will be required to record and track their data in multiple ways and reflect on what they learned at the end. I
Grades:
7th - 10th
Types:

Small Intestine Simulation- Villi at Work
For use with my M'Kenna Lessons 7 & 8. Student work packet. Includes running the simulation, collecting data, finding averages, rounding to the nearest tenth, graphing on paper and the computer, and answering reflection questions.
Grades:
6th - 8th
Types:
Also included in: M'Kenna Unit | In Person

Ordered Pairs: Quadrants & Signs
This 16-slide PowerPoint presentation stresses quadrant location and the signs of the ordered pairs that fall into each particular quadrant. It assumes prior knowledge of plotting & identifying points in the coordinate plane. Examples lead students to try to first figure out on their own what a set of un-plotted order pairs have in common. The pairs will fall in the same quadrant and all x-coordinate signs will match as well as all y-coordinates matching. Students can take a 5-question quiz
Grades:
6th
CCSS:
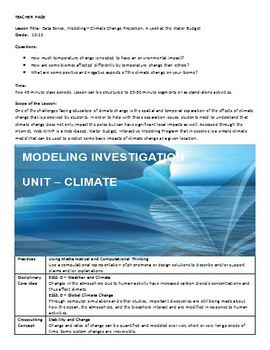
Environmental Science - Water Budget Modeling
Scope of the Lesson:One of the challenges facing educators of climate change is the spatial and temporal separation of the effects of climate change that is perceived by students. In order to help with these separation issues, students need to understand that climate change does not only impact the poles but can have significant local impacts as well. Accessed through the internet, WebWIMP is a Web-based, Water budget, Interactive Modeling Program that in essence is a simple climate model that c
Subjects:
Grades:
10th - 12th
Types:
Number Lines: Distance between Points
This 23-slide PowerPoint presentation is recommended as useful instruction before learning to calculate distance between points in a coordinate plane (CCSS.MATH.CONTENT.6.NS.C.8). It is meant for students who have already learned about absolute value, but have not learned about basic operations involving negative numbers yet (i.e. addition/subtraction). Students will learn how to calculate the distance between any two points on a number line using their absolute values. They will see that this s
Subjects:
Grades:
6th
CCSS:
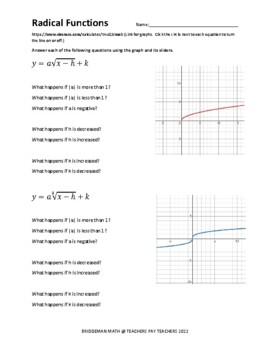
Graphing Radical Functions on Desmos
Introduction to radical functions that allows students to manipulate the parent graphs to see the effects of changing a, h, and k.
Subjects:
Grades:
9th - 12th
Types:
CCSS:
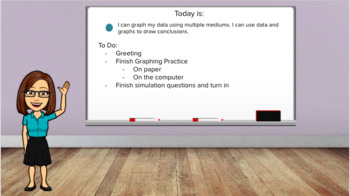
M'Kenna Lesson 8 | In Person
Based on OpenSciEd's Metabolic Reactions unit. Students finish their graphs from the villi simulation. They complete a graph on paper and using a spreadsheet, then answer reflection questions. Students should decide that taller villi allow for more food absorption because they have more cells, and more cells mean more "doorways" the food molecules can go through. Most will also decide that M'Kenna's villi are probably short or flat. If they need further evidence they can think about the small in
Grades:
6th - 8th
Types:
Also included in: M'Kenna Unit | In Person

Ordered Pairs: Sign Changes & Reflections
This 20-slide PowerPoint presentation tests and develops three rules involving reflections resulting from sign changes in an ordered pair. The three rules involve changing the x-coordinate sign only, changing the y-coordinate sign only, and changing both coordinate's signs. Thus the result is reflection across the y-axis, reflection across the x-axis, and reflection across the origin, respectively. Students are expected to have previous knowledge of plotting & identifying ordered pairs, iden
Grades:
6th
CCSS:
Showing 1-24 of 60 results


