1,287 results
Graphing interactive notebook pdfs
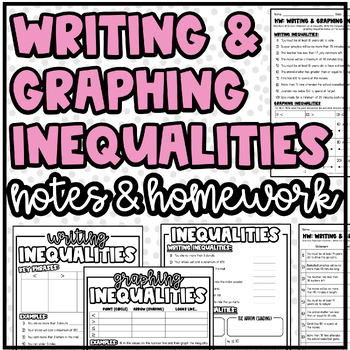
Writing & Graphing Inequalities | Notes & Homework or Practice
Writing & Graphing Inequalities Notes & Homework:This resource includes notes pages and homework/practice that goes along with the notes! It's organized, clean, and ready to go! All you need to do is print! :) Make sure you check the previews for a visual! Includes:Notes: Writing InequalitiesNotes: Graphing InequalitiesNotes: Writing & Graphing Inequalities (this is a combined notes page of the two above - same problems - just merged onto one page)Homework: Writing & Graphing Ine
Grades:
5th - 7th
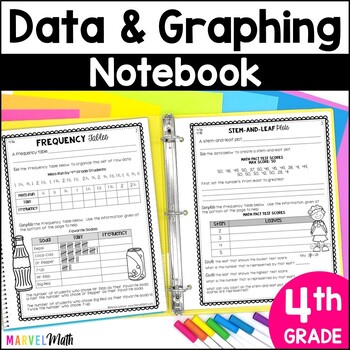
4th Grade TEKS Dot Plots, Stem and Leaf Plots, Graphs, Data Analysis Notebook
This no prep Data Analysis and Graphs notebook thoroughly covers the 4th grade Data Analysis and TEKS: 4.9A & 4.9B. Simply print and hole punch and this notebook is ready for you to teach dot plots, stem-and-leaf plots and frequency tables. Use the pages for whole class or small group guided math lessons while also helping students build their own reference tool.This is a TEKS centered resource. While others may be “TEKS-aligned,” they often cover Common Core standards as well. My Texas
Subjects:
Grades:
4th
Also included in: Math Interactive Notebook 4th Grade - TEKS Bundle
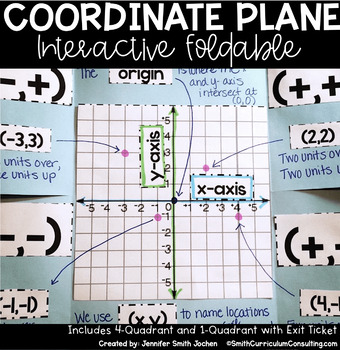
Coordinate Plane Four Quadrant and One Quadrant Flippables
Identifying Ordered Pairs within a Four Quadrant Graph, or a One Quadrant Coordinate Plane, are one of the most fun skills for students! This 4-Flap Interactive Foldable is perfect for students to identify the origin, x-axis, y-axis and coordinate pairs and the mini book allows students to identify the origin, x-axis, y-axis, and positive coordinate pairs.The Ordered Pairs Interactive Foldables are a set of unique reference tools that I have been using in my classroom as a part of our Interactiv
Grades:
4th - 6th
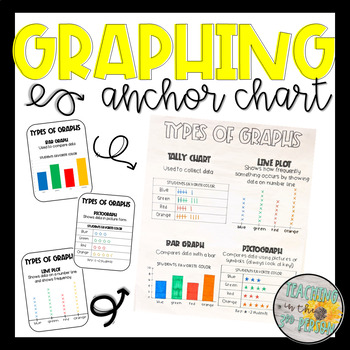
Types of Graphs Anchor Chart - Tally Chart, Bar Graph, Pictograph, Line Plot
Graphing made easy!Use these templates as a guide in creating your own anchor charts or print and use them in other helpful ways:Trace and create an anchor chart with studentsPrint on bright colored paper and use as postersShrink down and glue in student' math notebooks for a reference sheetPrint and send home as reference tools for students and parents (homework or tutoring)Earn Credit for Future Purchases:I appreciate each & every word of your valuable feedback. Also, if you leave feedback
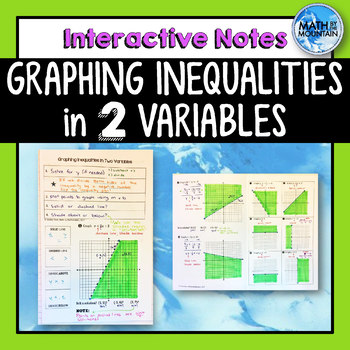
Graphing Linear Inequalities in 2 Variables Interactive Notebook Notes
These notes are perfect for an interactive notebook (INB) and are built to reinforce prior concepts. Help your students see the process graphing inequalities in two variables on the coordinate plane. Explore the special cases of vertical and horizontal inequalities! In some examples, students must solve for y prior to graphing, which is a fantastic review of (1) rerwriting equations, (2) remembering the flip the sign, and (3) identifying slope and y-intercept! The front page of these notes are
Subjects:
Grades:
6th - 10th
CCSS:
Also included in: Unit 7 - Systems of Equations & Inequalities - Interactive Notebook Kit
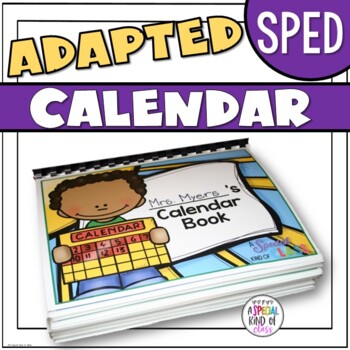
Adapted Calendar for SPED students
Do you need a calendar book that ALL your students can use, no matter what their ability is? This interactive adapted daily calendar is designed for children with special needs, ESL, ELL and pre-K. Requiring no printing skills, this calendar book has movable pieces for students to manipulate. Children with little to no verbal skills can also use this calendar as they are able to demonstrate their knowledge without using speech. The package includes multiple girl and boy covers in both color
Subjects:
Grades:
PreK - 1st
Also included in: Yearlong Adapted Calendar for SPED bundle
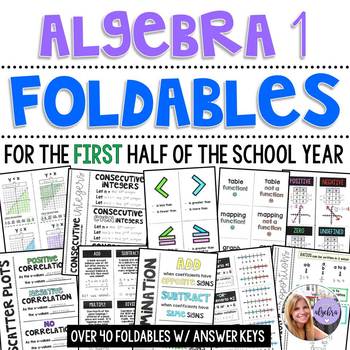
Algebra 1 - First Half of the School Year FOLDABLE BUNDLE
This is a list of the currently uploaded foldables in this bundle. It is an ever-growing bundle that will continue to be updated, so for one price you can always have every resource! This has a current value of over $63 if bought separately! Check out my store for individual views of foldables. A second-half of the year set is also in my TPT store, as well as corresponding task cards and games!Variables and ExpressionsOrder of OperationsThe Number Properties (Chart added as the bonus file No
Subjects:
Grades:
7th - 10th
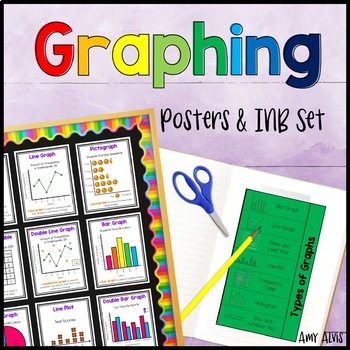
Graphing Posters & Interactive Notebook Bar Graph Picture Graph Line Plot
This poster or anchor chart and interactive notebook (INB) set includes FOURTEEN posters covering bar graphs, double bar graph, pictographs, picture graph, line graphs, double line graph, line plot, circle graphs, frequency tables, sector graph, stem and leaf plots, histograms, dot plots, parts of a graph and box and whisker plots. This set also includes SIX different foldable interactive notebook (INB) pages (that you print and put into a paper notebook) for students to take notes as well as a
Subjects:
Grades:
2nd - 5th
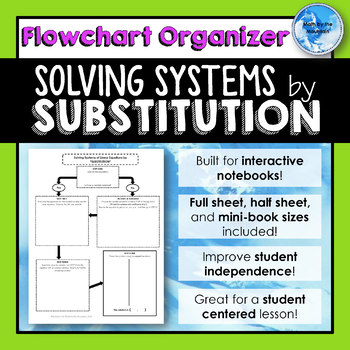
Solving Systems of Equations by SUBSTITUTION *Flowchart* Graphic Organizers
Help your students visualize the solving process for the substitution method of solving systems of linear equations. Students are able to easily lead themselves or others through a problem, even if it is their first time using this method. Includes*Solving by Substitution Flowchart Graphic Organizer (half-sheet size)*Solving by Substitution Flowchart Graphic Organizer (full-sheet size)*Solving by Substitution Flowchart Graphic Organizer (mini-book size)Half sheets and mini-books are great for in
Grades:
7th - 12th
CCSS:
Also included in: Systems of Equations *Flowchart* Graphic Organizers BUNDLE
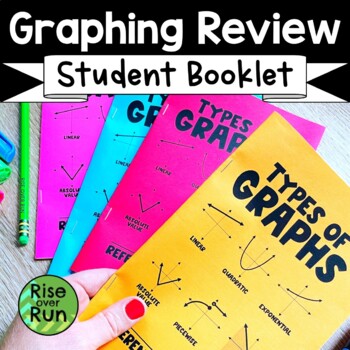
Algebra 1 Review Booklet for Graphing Different Types of Functions
Help your students prepare for end of year testing! They can review all the type of graphs they have learned: linear, quadratic, exponential, absolute value, piecewise, inequalities, and systems of equations. This booklet brings together all the graphing concepts students have learned. This booklet includes:LinearQuadraticExponentialAbsolute ValuePiecewiseInequalitiesSystemsStudents identify what the different types of relations look like on a graph, as an equation, and in a table of values.
Subjects:
Grades:
8th - 9th
CCSS:
Also included in: Algebra 1 and 8th Grade Math Curriculum Bundle for Entire Year
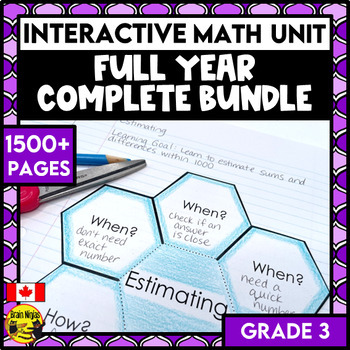
Math Unit Year Long Bundle | Grade 3 | Interactive Math Units for Canada
What if you could have your entire year of math lesson plans written for you? Our interactive notebook comes with everything you need to plan, teach, practice, and assess math. We give you everything you need to explicitly teach concepts for place value, number operations, patterns, graphing, measurement, time, geometry and more in your Canadian Grade 3 classroom.This engaging resource includes:6 complete units.a bonus year plan to help sequence your year.instructions for how to set up, assess,
Subjects:
Grades:
2nd - 4th
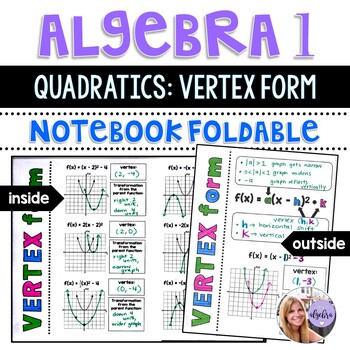
Algebra 1 - Transformations of Quadratic Functions - Vertex Form - Foldable
This is a foldable designed for interactive math notebooks. There are also 2 bonus pages of practice problems for the students to do, as well!Here is the link of me teaching this lesson using this resource on YouTube! Feel free to use this as additional support for your students. https://www.youtube.com/watch?v=lKABemkVP7c&list=PLDKrf9k92mfhAvVHMJ4Xu_Hcw-9fRV6jQ&index=6&t=3sThis foldable walks students through the process of the following transformations:Each graph starts with the p
Subjects:
Grades:
8th - 11th
Also included in: Algebra 1 - Second Half of the School Year Foldable GROWING BUNDLE
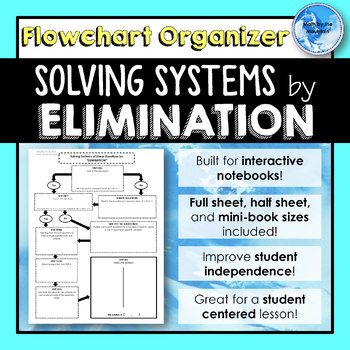
Solving Systems of Equations by ELIMINATION *Flowchart* Graphic Organizers
Help your students visualize the solving process for the elimination method of solving systems of linear equations. Students are able to easily lead themselves or others through a problem, even if it is their first time using this method. Includes*Solving by Elimination Flowchart Graphic Organizer (half-sheet size)*Solving by Elimination Flowchart Graphic Organizer (full-sheet size)*Solving by Elimination Flowchart Graphic Organizer (mini-book size)Half sheets and mini-books are great for intera
Grades:
7th - 12th
CCSS:
Also included in: Systems of Equations *Flowchart* Graphic Organizers BUNDLE
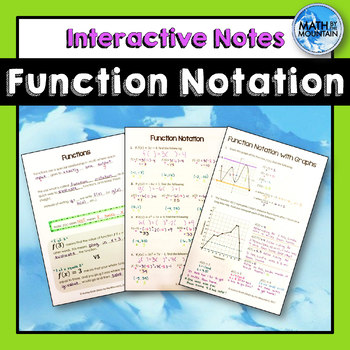
Function Notation Interactive Notebook Notes
Help your students learn how to read, interpret, and evaluate function notation from equations, graphs, and tables. These notes offer a great blend of representations and different levels of rigor to meet the needs of all of the learners in your classroom. THREE resources are included:A reference half-sheet that discusses the difference in function notation meanings to clear up common misconceptions. A mini-book set of notes that covers algabraic representations of function notation. A mini-book
Subjects:
Grades:
8th - 11th
CCSS:
Also included in: Functions, Relations, and Domain and Range BUNDLE
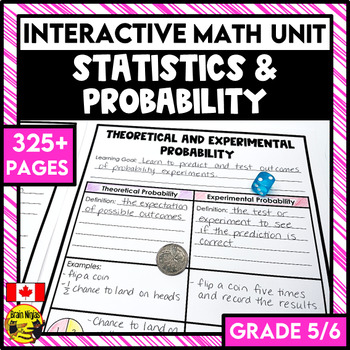
Statistics Graphing and Probability Interactive Math Unit | Grade 5 and Grade 6
Stop searching for your statistics and probability lessons. Everything you need to teach, practice, and assess double bar graphs, line graphs, stem and leaf plots, and probability is included in this print-and-use unit. Your planning for your graphing and probability unit is already done for you!This unit is part of the Full Year Interactive Math Unit Bundle for Grade 5/6. It comes with a bonus sequencing guide to help plan your whole year.This all-inclusive resource includes:instructions for ho
Subjects:
Grades:
5th - 6th
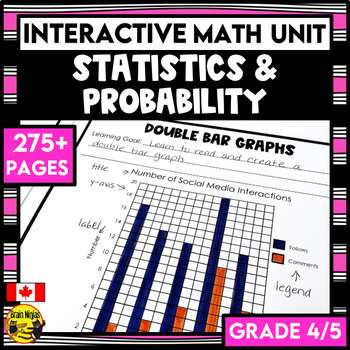
Statistics Graphing and Probability Interactive Math Unit | Grade 4/5
Stop searching for your statistics and graphing lessons. Everything you need to teach, practice, and assess bar graphs, pictographs, double graphs, stem and leaf plots and probability is included in this print-and-use unit. Your planning for your graphing unit is already done for you!This unit is part of the Full Year Interactive Math Unit Bundle for Grade 4/5. It comes with a bonus sequencing guide to help plan your whole year.This convenient resource includes:instructions for how to set up, as
Subjects:
Grades:
3rd - 5th
Piecewise Functions Practice Activity
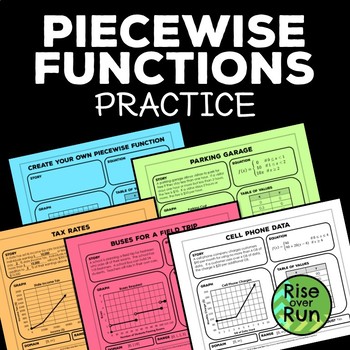
Practice using piecewise functions with these 5 sheets of multiple representations. Students fill in the missing information by completing a story, equation, graph, and table of values. Then they identify the domain, range, and whether the function is continuous. A step function is included. These are great to use for partner work, individual practice, or assessments. The fifth sheet is a blank template, so students can create their own piecewise functions. Two options are included for p
Grades:
9th - 12th
CCSS:
Also included in: Algebra 1 and 8th Grade Math Curriculum Bundle for Entire Year
Interactive Notebook - Pictographs and Bar Graphs {3.MD.3}
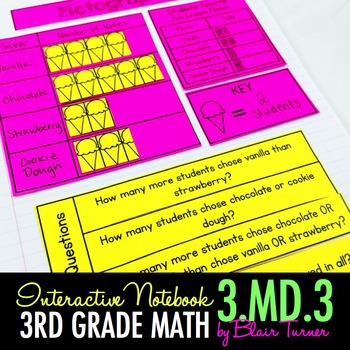
3rd Grade Math Notebooks: Pictographs and Bar GraphsCCSS.Math.Content.3.MD.B.3 Draw a scaled picture graph and a scaled bar graph to represent a data set with several categories. Solve one- and two-step “how many more” and “how many less” problems using information presented in scaled bar graphs. Included:•Directions with photographs for each activity•I Can Statement and Vocabulary Flapbook with Definitions for Each Term•Make a Bar Graph with Word Problem Flapbook •Make a Pictograph with Word Pr
Subjects:
Grades:
3rd
CCSS:
Also included in: Interactive Notebook: 3rd Grade CCSS Measurement and Data BUNDLE
Scatter Plot Cheat Sheets Printable Guided Notes
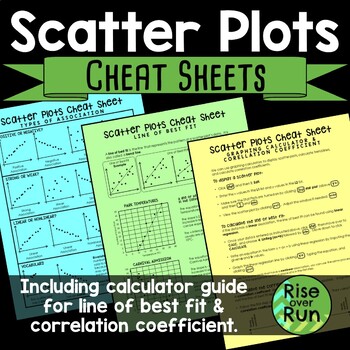
Detailed sheets for the following topics: •Types of Association & VocabularyThis page shows examples of positive, negative, strong, weak, linear, and nonlinear association. It also shows clusters and outliers.•Line of Best FitThis page explains what a line of best is (or trend line) along with examples and nonexamples. It has 2 real world connections and how to interpret the line of best fit.•Graphing Calculator Guide & Correlation CoefficientThis sheet gives step by step instructions fo
Subjects:
Grades:
8th - 9th
CCSS:
Also included in: 8th Grade Math Activities & Lessons Bundle for the Whole Year
Interactive Notebook Activities - Rectilinear Area Concepts {3.MD.7}
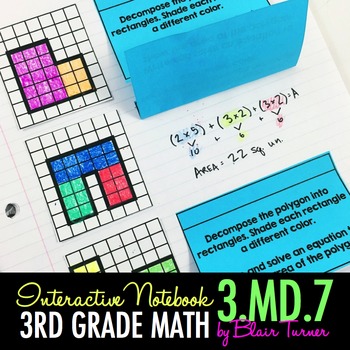
3rd Grade Math Notebooks: Area / Additive AreaCCSS.Math.Content.3.MD.C.7 Relate area to the operations of multiplication and addition.CCSS.Math.Content.3.MD.C.7a Find the area of a rectangle with whole-number side lengths by tiling it, and show that the area is the same as would be found by multiplying the side lengths.CCSS.Math.Content.3.MD.C.7b Multiply side lengths to find areas of rectangles with whole-number side lengths in the context of solving real world and mathematical problems, and re
Subjects:
Grades:
3rd
Also included in: Interactive Notebook: 3rd Grade CCSS Measurement and Data BUNDLE
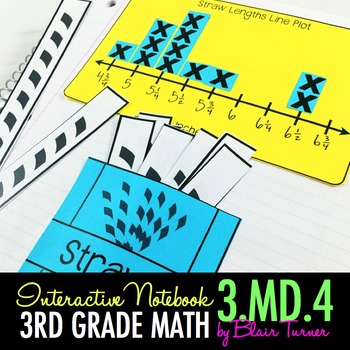
Interactive Notebook Activities - Measure to the 1/4 Inch & Line Plots {3.MD.4}
3rd Grade Math Notebooks: Line PlotsCCSS.Math.Content.3.MD.B.4 Generate measurement data by measuring lengths using rulers marked with halves and fourths of an inch. Show the data by making a line plot, where the horizontal scale is marked off in appropriate units— whole numbers, halves, or quarters.Included:•Directions with photographs for each activity•I Can Statement and Vocabulary Flapbook with Definitions•Giant Ruler Accordion Flapbook•2-Piece Foldable Ruler•Transparency Ruler Flipbook•Coun
Subjects:
Grades:
3rd
CCSS:
Also included in: Interactive Notebook: 3rd Grade CCSS Measurement and Data BUNDLE
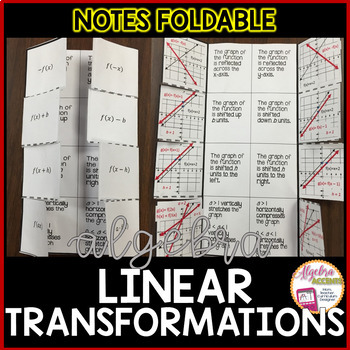
Graphing Linear Transformations Foldable
Students will create an interactive notebook foldable with eight linear transformations which include reflections across both x- and y- axis, vertical and horizontal shifts, and vertical and horizontal stretches/compressions. Notes include a verbal description, graphic representation and its function notation with f(x) and its transformation as g(x). Two versions included: pre-filled and blank.CLICK HERE to view a listing of all the LINEAR FUNCTIONS Resources in my store. ______________________
Subjects:
Grades:
8th - 11th
Types:
Also included in: BACK TO SCHOOL | ALGEBRA 1 LINEAR EQUATIONS | FUNCTIONS Bundle
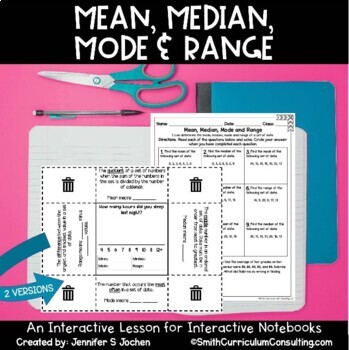
Mean, Median, Mode and Range Foldable Interactive Notebook Lesson with Practice
Ready to review the basics of Mean, Median, Mode and Range? This flippable has all that you need for your students to have a resource for the definition, a keyword to help them remember, as well as a graph to compile data from the class and determine the Mean, Median, Mode, and Range for your class data!Includes:Teacher Directions with a full-color photoMean, Median, Mode, and Range Foldable (2 versions)Mean, Median, Mode, and Range Practice SheetMean, Median, Mode, and Range Practice Sheet Answ
Subjects:
Grades:
5th - 7th
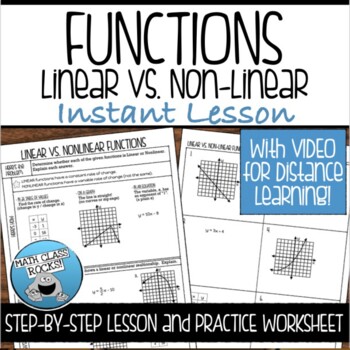
LINEAR VS NONLINEAR FUNCTIONS GUIDED NOTES AND PRACTICE
Save time and make your life easy with these LINEAR VS NONLINEAR FUNCTIONS GUIDED NOTES and PRACTICE WORKSHEET! Perfect for introducing a new concept, reviewing a previously learned skill, or your interactive notebook! These guided notes will simplify every lesson with step-by-step examples and practice problems to provide a year-long resource for your students to refer to again and again!This lesson is included in my Functions Instant Lesson BUNDLE. Click HERE to view this resource and SAVE 2
Grades:
7th - 9th
CCSS:
Also included in: 8th GRADE MATH GUIDED NOTES AND PRACTICE FULL YEAR BUNDLE
Showing 1-24 of 1,287 results


