96 results
Middle school graphing scaffolded notes for Google Apps
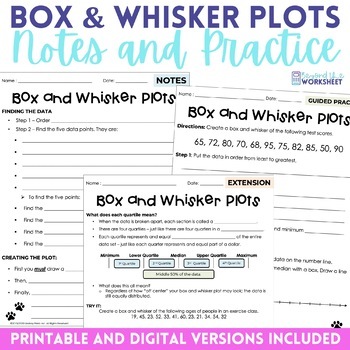
Box and Whisker Plots | Data Analysis Math Notes and Practice
⭐️⭐️ Elevate Data Analysis Skills with this Box and Whisker Plot Activity! This comprehensive resource takes students on a step-by-step journey to master the art of creating and interpreting box and whisker plots, a crucial skill for understanding data distribution. ✅ What's Included:Detailed Instructional Notes: A page of in-depth guidance ensures students grasp the concept thoroughly.Guided Practice Sheet: Hands-on learning becomes a breeze with this interactive worksheet.Extension Sheet: Chal
Grades:
6th - 7th
Types:
Also included in: 6th Grade Math Curriculum Supplemental Activities Bundle
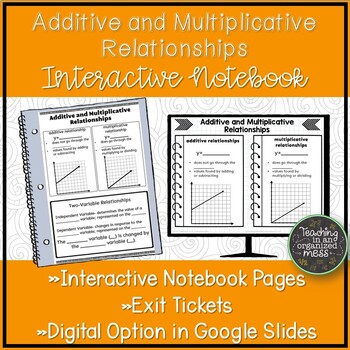
Additive and Multiplicative Relationships Interactive Notebooks TEKS 6.6C
These notebook pages describe the differences between additive and multiplicative relationships and how they can be represented in tables, graphs, and equations. Students will make a booklet that will fit inside their interactive math notebook without cutting anything. Two versions are included, one with fill in the blanks (CLOZE style notes) and one with all notes filled in.This resource includes a link to copy a Digital Notebook into your Google Drive. Part of the following BundleTwo Variable
Grades:
5th - 6th
Also included in: Two Variable Relationships BUNDLE
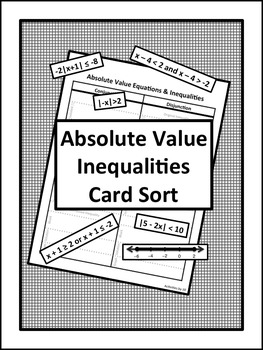
Absolute Value Inequalities Card Sort (Digital/PDF)
This download includes both a PDF and digital Google Slides version of this activity.DIGITAL: Use the link to access a Google Slides version of this resource. Students will arrange the movable pieces into the correct positions on the outline.PDF: Complete the cut and paste activity using paper. Arrange the movable pieces into the correct positions on the outline.Solving and graphing absolute value inequalities can be a challenging concept for algebra students to understand. This card sort can
Grades:
7th - 10th
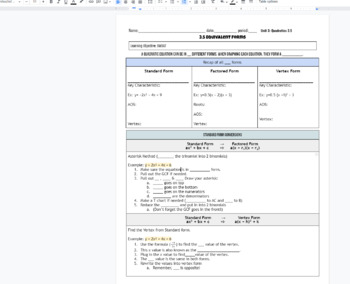
Converting between 3 forms of quadratic equations (equivalent functions) notes
Unit 3: 3.5 Converting between 3 forms of quadratic equations (equivalent functions) notes. In these scaffolded notes / graphic organizers students convert between standard, factored, and vertex form quadratic equations. The notes are broken up to show the steps on how to go from one to another. This also tells how a parabola can look like 3 different equations.Doc is editable. KEY is included in title and at the bottom of the doc. math 2 HS class. (see 3.1, 3.2, 3.3, 3.4 for previous notes!)
Subjects:
Grades:
7th - 12th, Higher Education, Adult Education
CCSS:
Also included in: Quadratic Forms & Characteristics Unit Notes & Homework
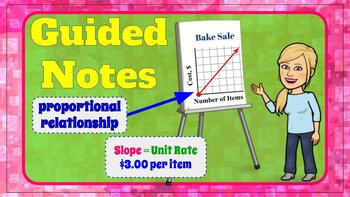
Proportional Relationships & Slope as Unit Rate Lesson & Guided Notes
You are purchasing an editable copy of a Google Document with two column GUIDED notes AND these two column notes can be used along with these Googles slides or with this video lesson.In this video lesson we will learn about proportional linear relationships and slope. We will begin by understanding that proportional linear relationships are special linear relationships whose graph is a line passing through the origin. We will apply our understanding of ratios, rates, and unit rates to slope. We
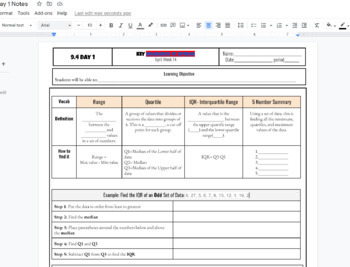
IQR interquartile Range and 5 number summary box and whisker plot Notes
IQR interquartile Range and 5 number summary box and whisker plot Notes including Q1, Q2, Q3, Min and Max and step by step both examples of finding the IQR and creating a box and whisker plot. Used in HS math 1 class WITH KEY INCLUDED AS a link to a printable PDF
Subjects:
Grades:
7th - 12th, Higher Education, Adult Education
CCSS:
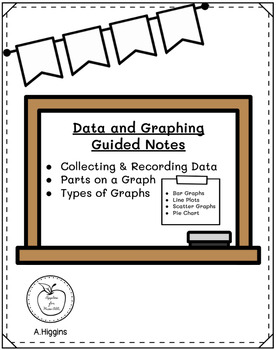
Data & Graphing Guided Notes, Practice, and Assessment
Empower your students to become data detectives! This engaging 6-page guided notes activity provides a comprehensive framework for teaching students the fundamental skills of collecting, recording, and analyzing data.What's Included:Clear and Concise Explanations: Each page focuses on a specific topic, including: Collecting Data: Different methods of data collection (surveys, observations, experiments) are explained with real-world examples.Recording Data: Students learn how to organize data usi
Subjects:
Grades:
3rd - 6th
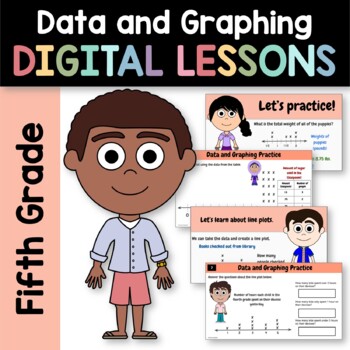
Data and Graphing 5th Grade Interactive Google Slides | Math Skills Review
Teach data and graphing - line plots for fifth grade with these two interactive digital Google Slides Presentations. What's included? One Google Slides interactive presentation with 27 slides that teaches about data and graphingOne Google Slides interactive presentation with 10 slides where students can practice more by moving objects, entering answers, filling color, and more, all digitallyPowerPoint presentations of same contentPDF versions of same contentAnswer keysInstructions for setting up
Subjects:
Grades:
4th - 6th
Types:
CCSS:
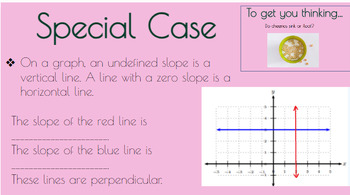
Guided Notes: Parallel and Perpendicular lines
These are fill in the blank notes and practice activities for defining and identifying parallel and perpendicular lines from slopes, equations and graphs. I printed these slides for students with 2 slides per page and used the document camera to takes notes as we went.Answer key is listed as a free resource on my page.
Grades:
8th - 10th
Types:

Linear Function Graph Write Equations Slope Formula Review and Quiz Bundle
This Google Folder collection will help you teach the students the following lessons:Determine if the slope is positive, negative, zero or undefinedFind slope from a graphGraph the line given the slope and y-interceptFind the slope using the slope formulaFind the slope and y-intercept when equation is in slope-intercept formGraph the line given the equation in slope-intercept formGraph the line given the standard form equation by finding x and y interceptsWrite equation given slope and y-interce
Subjects:
Grades:
7th - 10th
Types:
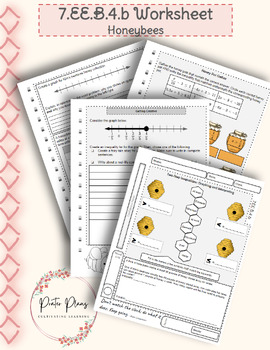
Math Adventures with Honeybees: Two-Step Inequalities Worksheet | Printable
Embark on a mathematical journey through the captivating realm of honeybees with our engaging "Inequalities Expedition" worksheet! This dynamic resource immerses 7th-grade students in the world of inequalities while offering thrilling brain breaks and creative activities to enrich their learning adventure.Worksheet Highlights: From unraveling the mysteries of honey storage to navigating the buzzing world of bee travel, each problem on the worksheet presents an exhilarating challenge rooted in re
Subjects:
Grades:
7th
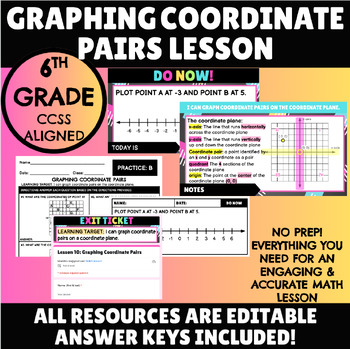
Graphing Coordinate Pairs on the Coordinate Plane Lesson - No Prep!
Do you need to teach your 5th or 6th grade students how to plot coordinate pairs on the coordinate plane?This lesson is a well-prepared, standards aligned math lesson on graphing coordinate pairs or ordered pairs on the coordinate plane. It includes examples in all 4 quadrants. Students will be asked to identify the coordinate pairs of given points as well as plot given coordinate pairs on the coordinate plane on their own. Students love how easy these slides and notes are to follow and under
Subjects:
Grades:
5th - 6th
Types:
CCSS:
Also included in: Graphing Coordinate Pairs on the Coordinate Plan - Full Lesson! No Prep!
8th Grade Pre Algebra Digital Math Notes Full Year
This Google Slide presentation is a digital notebook and resource for students to use with all topics taught in 8th grade math. Unit 1: Laws of ExponentsUnit 2: Scientific NotationUnit 3: TransformationsUnit 4: Equations IntroUnit 5: Transversal and TrianglesUnit 6: Number of SolutionsUnit 7: Proportional RelationshipsUnit 8: Non-Proportional RelationshipsUnit 9: Systems of EquationsUnit 10: FunctionsUnit 11: StatisticsUnit 12: VolumeExamples and rules included for each.
Grades:
8th

Graphing Coordinate Points Notes & Battleship Game (Digital Activity)
This download includes 1 Google Slide Decks with 4 slides (Student Version) and another Google Slide deck with the teacher version/answer key. Each student will need a digital or printed copy of the slides to participate in the game.The first two slides consist of notes. Slide one covers definitions and labeling the coordinate plane while defining key vocabulary such as quadrants, x and y axis, and the origin.Slide two includes information on how to graph coordinate points, and allows the studen
Grades:
6th - 8th
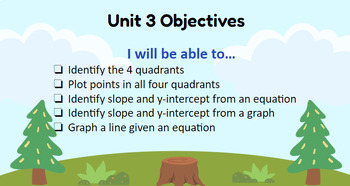
Slope-Intercept Form; Graphing & Equations-Interactive Slides
Slide deck (meant to be printed for students to complete on paper or can be translated into a PearDeck)Covers the following topicsVocabulary relating to graphing points and lines How to identify slope and y-intercept from equations How to identify slope and y-intercepts from graphsHow to graph a line given an equation Answer Key: https://web.kamihq.com/web/viewer.html?state=%7B%22ids%22%3A%5B%2212BqMVBHUAq1fIGTD19g1Oc1oAxlALESk%22%5D%2C%22action%22%3A%22open%22%2C%22userId%22%3A%2211031764706798
Subjects:
Grades:
7th - 9th

Review and Quiz Linear Equations Functions Graphing Writing Slope Formula
This product will help you review and quiz on graphing and writing linear equations.Topics include:Determining if the slope of a line is positive, negative, zero or undefinedUsing rise/run to find the slopeChoosing points on the graph to use to determine the slopeRewriting equations into slope-intercept formGraphing equations that are in slope-intercept formGraphing equations that are in standard formFinding x and y interceptsGraphing horizontal and vertical linesWriting equations given slope an
Subjects:
Grades:
8th - 10th
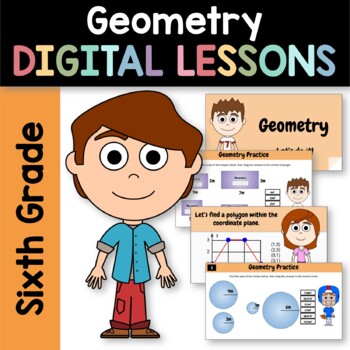
Geometry for Sixth Grade | Interactive Google Slides | Math Skills Review
Teach Geometry for the sixth grade with these two interactive Google Slides Presentations. What's included? · 2 Google Slides Presentations: One Google Slides Interactive Presentation with 57 slides that teaches about geometry. One Google Slides Interactive Presentation with 10 slides where students can practice more by moving objects, filling in color, entering answers, and more, all digitally.· PowerPoint Presentations of same content.· PDF versions of same content.· Answer Keys· PDF file to h
Subjects:
Grades:
5th - 7th
Types:
Graphing and Statistics for Biology Google Slides + Guided Notes
Keep your students engaged and accountable with this BUNDLE that includes a google slides presentation AND corresponding guided notes. Students can use these slides and notes to complete as an assignment, use as a study guide, or to simply to guide them through a lesson in the classroom and at home.The topics covered in this presentation include:Identifying types of DataConstructing Data TablesCalculating Mean, Median, Mode, Range & Standard DeviationPlotting a GraphInterpolation & Extra
Subjects:
Grades:
6th - 12th, Higher Education
Types:
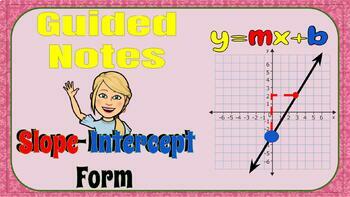
Graphing Slope-Intercept Form Guided Notes
You are purchasing an editable Google Document of two column guided notes to accompany this free YouTube video. A perfect lesson for a substitute or an independent homework assignment to support flipping your classroom.In this video lesson we will discover that when a linear equation is solved for y it is written in slope-intercept form. We will learn that slope-intercept form is y=mx + b where m represents the slope of the line and b represents the y-intercept of the line. Our essential ques
Grades:
8th
Types:
CCSS:
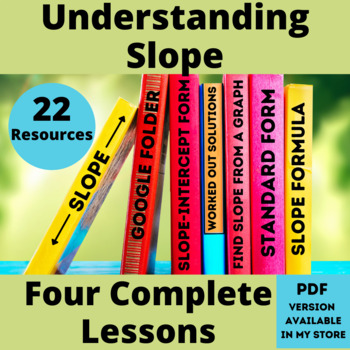
Understanding Slope and Linear Equations Graph Standard and Slope-Intercept Form
This Google Folder collection will help you teach the students the following lessons:Determine if the slope is positive, negative, zero or undefinedFind slope from a graphGraph the line given the slope and y-interceptFind the slope using the slope formulaFind the slope and y-intercept when equation is in slope-intercept formGraph the line given the equation in slope-intercept formGraph the line given the standard form equation by finding x and y interceptsEach set includes several resources:Guid
Subjects:
Grades:
7th - 10th
Types:
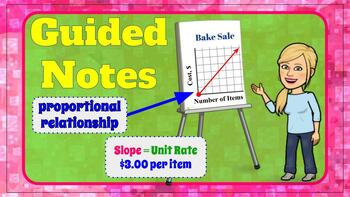
Proportional Linear Relationships & Slope as Unit Rate Guided Notes
You are purchasing an editable copy of a Google Document with two column GUIDED notes. These two column notes can be used along with these Googles slides or with this video lesson.In this video lesson we will learn about proportional linear relationships and slope. We will begin by understanding that proportional linear relationships are special linear relationships whose graph is a line passing through the origin. We will apply our understanding of ratios, rates, and unit rates to slope. We
Subjects:
Grades:
8th
Types:
Also included in: Proportional Relationships & Slope as Unit Rate Lesson & Guided Notes
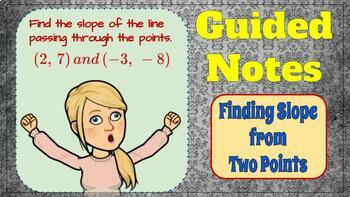
How to Find Slope Guided Notes
You are purchasing an editable Google Document of two column guided notes to accompany this free YouTube video. A perfect lesson for a substitute or an independent homework assignment to support flipping your classroom.In this video lesson we will first discus slope as a ratio. We will discover that the ratio of the rise over the run is slope. We will discover the rise is the change in y or vertical distance between two points. We will learn that the run is the change in x or the horizontal
Grades:
8th
Types:
CCSS:
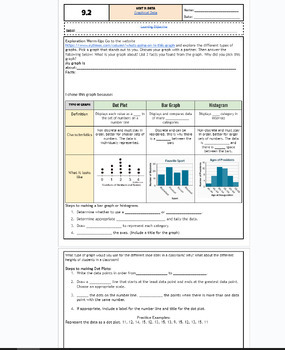
Graphical Data: Bar Charts, Dot Plots and Histograms fillable notes UPDTD
Unit 9: Data and Stats: UpdatedUpdated9.2 Graphs: bar, dot plot, histpgramStudents go over the vocabulary and define each type fo graph and what data fits for each graph. The warm up is an exploratory activity where students go on a website to search for their graph of interest and discuss the key findings. This takes around 10-15 mins and students enjoyed it! Notes are scaffolded. Includes hook video hyperlinked on the "learning objective" title. Key is included and hyperlinked as a PDF in the
Subjects:
Grades:
6th - 12th, Higher Education, Adult Education
CCSS:
Also included in: Unit 9: Data and Statistics Fillable Notes
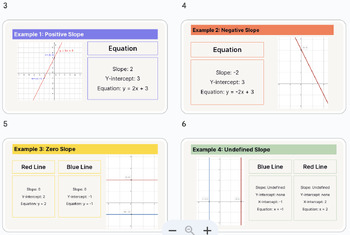
Notes and Exit Ticket for Graphing Lines Using Slope Intercept Form
This includes two versions of the notes I use to teach graphing lines using slope-intercept form. The first version is a completed version. The second version is a fill-in-the-blank version that can be printed for students or posted on Google Classroom for them to fill out digitally. I have also included a Google Form with a 10-point exit ticket-type quiz that I use to check in with the students at the end of the lesson.
Grades:
6th - 9th
Showing 1-24 of 96 results


