65 results
Middle school graphing graphic organizers for Google Apps
Proportional & Non-Proportional Tables Task Cards and Google Acitivites
UPDATED: Now includes google slide and google form activity that matches the task cards to help with distance learning. (Task Cards and google activity questions are the same). I used this activity in both my 15:1 and 15:1:1 7th grade math class. The scaffolded answer sheet allowed the students to understand the steps they needed to take to come to an answer. You can use this product by posting the tables around the room and the students go around with the answer sheet. You could also use it as
Subjects:
Grades:
7th
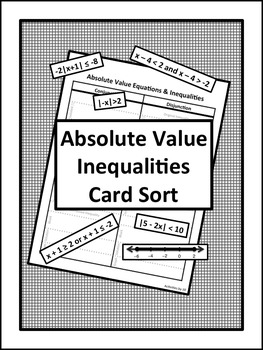
Absolute Value Inequalities Card Sort (Digital/PDF)
This download includes both a PDF and digital Google Slides version of this activity.DIGITAL: Use the link to access a Google Slides version of this resource. Students will arrange the movable pieces into the correct positions on the outline.PDF: Complete the cut and paste activity using paper. Arrange the movable pieces into the correct positions on the outline.Solving and graphing absolute value inequalities can be a challenging concept for algebra students to understand. This card sort can
Grades:
7th - 10th
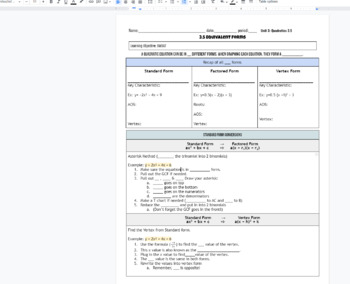
Converting between 3 forms of quadratic equations (equivalent functions) notes
Unit 3: 3.5 Converting between 3 forms of quadratic equations (equivalent functions) notes. In these scaffolded notes / graphic organizers students convert between standard, factored, and vertex form quadratic equations. The notes are broken up to show the steps on how to go from one to another. This also tells how a parabola can look like 3 different equations.Doc is editable. KEY is included in title and at the bottom of the doc. math 2 HS class. (see 3.1, 3.2, 3.3, 3.4 for previous notes!)
Subjects:
Grades:
7th - 12th, Higher Education, Adult Education
CCSS:
Also included in: Quadratic Forms & Characteristics Unit Notes & Homework
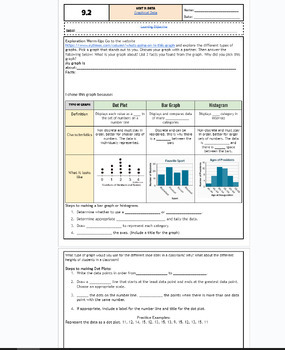
Graphical Data: Bar Charts, Dot Plots and Histograms fillable notes UPDTD
Unit 9: Data and Stats: UpdatedUpdated9.2 Graphs: bar, dot plot, histpgramStudents go over the vocabulary and define each type fo graph and what data fits for each graph. The warm up is an exploratory activity where students go on a website to search for their graph of interest and discuss the key findings. This takes around 10-15 mins and students enjoyed it! Notes are scaffolded. Includes hook video hyperlinked on the "learning objective" title. Key is included and hyperlinked as a PDF in the
Subjects:
Grades:
6th - 12th, Higher Education, Adult Education
CCSS:
Also included in: Unit 9: Data and Statistics Fillable Notes
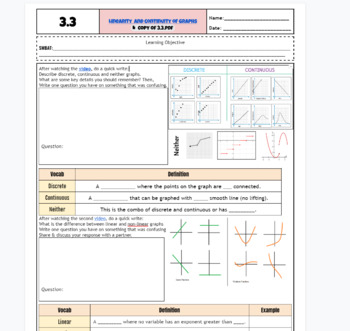
Discrete & continuous graphs (Linearity & Continuity) scaffolded notes w/ videos
3.3 Unit 3 Linearity and Continuity Lesson, this goes over the difference between discrete and continuous graphs and also what is linear and what is non-linear. Students use two different discussions warm up by watching a video from Youtube (LINKED ON THE NOTES!) to define the vocab in their own words. Many examples are given. Then students see the algebraic breakdown of linear and non linear equations. KEY IS INCLUDED linked in the title and bottom of the page with videos. Google doc is editabl
Grades:
7th - 12th, Higher Education, Adult Education
CCSS:

FREE Proportional Relationships Digital Notes Graphic Organizer
This FREE digital graphic organizer uses Google Slides to help students see proportional relationships in multiple representations- by a verbal description, table, graph, and equation. Students will type in text boxes to fill in the blanks and drag a line to complete the graph to show proportional relationships represented various ways. You can even have them highlight the constant of proportionality from each representation. There is also an option to print this notes page.Please follow me! - 8
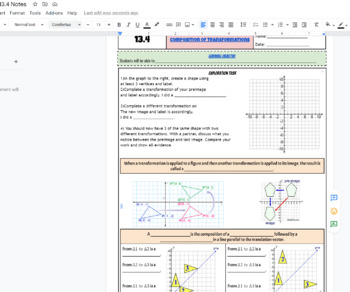
Compositions of Transformations Fillable Notes and Homework KEY included
Compositions of Transformations Fillable Notes and Homework KEY included (13.4) students will perform and know the difference between glide reflections and nonglide reflections. Students will perform 2 different transformations such as a translation than a reflection on the translation. Notes are scaffolded and fillable with images, live link to the website, warm-up exploration task to define the other transformations, and homework or practice with the key included (highlighted in red in the tit
Grades:
7th - 12th, Higher Education, Adult Education
CCSS:
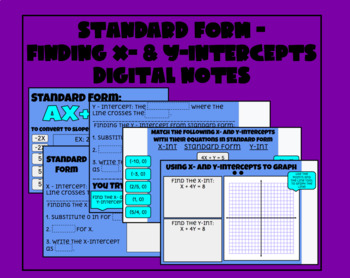
Standard Form - Finding X- and Y-Intercepts Digital Notes
Digital notes for introducing what standard form is, how to convert an equation in standard form to slope-intercept form, and how to find x- and y-intercepts from an equation in standard form and use them to graph. Would work great with an instructional video for virtual learning or a flipped classroom!
Grades:
7th - 8th
CCSS:
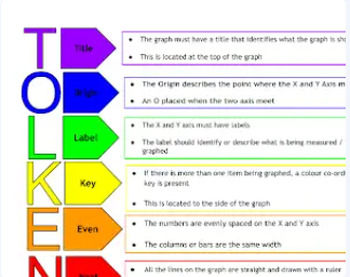
Graphing Graphic - What a Graph Needs - TOLKEN
Colourful A3 Graphic Laminate and display on the wall as a reminder for students or a quick self check! Shows the MUST HAVE'S for a graph This would also be great for students as a handout for students to glue into their books when introducing and practising graphing
Grades:
6th - 11th
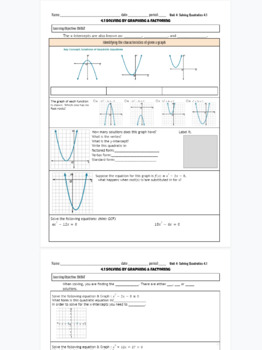
Solve Quadratic Equations by Graphing and Factoring fillable notes
Unit 4: Solving Quadratics 4.1 solve by graph and factoring fillable/scaffolded notes. (See Unit 3 for previous lessons). Students have learned all about the characteristics of quadratics including factoring, now they solve and see what the solutions represent on the graph. Using the zero product property and seeing the x-intercepts. This google doc is editable. KEY is included in the title and bottom of the doc. Used in HS math 2.
Subjects:
Grades:
7th - 12th, Higher Education, Adult Education
CCSS:
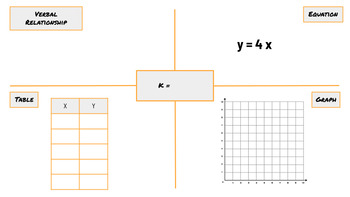
Representing Proportional Relationships (PRINT)
This activity works on applying proportional relationships to verbal descriptions, writing equations, tables and graphs. Students will be given one of the following (above) and use that to complete the other three. They will also need to solve for the constant of proportionality (k) in the relationship.
Subjects:
Grades:
6th - 8th
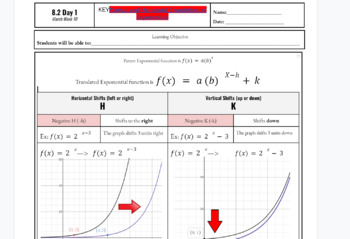
Translations of Exponential Functions Fillable Notes horizontal/vertical shifts
Translations of Exponential Functions Day 1 Fillable Notes- broken into two lessons to understand each translation. This one focuses on vertical and horizontal shifts with KEY included. Day 2 is with key is available for purchase.
Subjects:
Grades:
7th - 12th, Higher Education, Adult Education
CCSS:
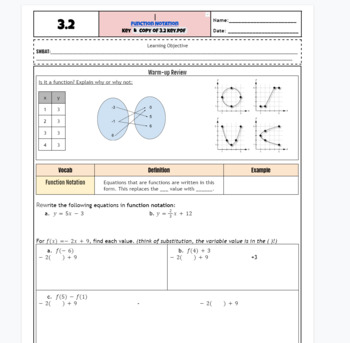
Function Notation scaffolded notes and practice
3.2 Unit 3 Relations/ Functions, this is the second lesson on function notation. Plugging in the value of x into a function to solve for the output of y. Includes a review warm-up of what a function is and is not in terms of a table, graph, and mapping. Includes word problems and fillable steps to solving with algebra. Used in Math 1 HS class. KEY IS INCLUDED in the title and at the bottom of the next page. Linked. THis google doc is editable to your liking and titles.
Grades:
7th - 12th, Higher Education, Adult Education
CCSS:
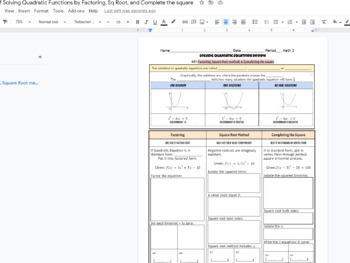
Solve quadratics by square root, complete the square, factoring notes graph org
Solve quadratics by square root, complete the square, factoring notes graph organizer with KEY INCLUDED! Practice problems on the back that can be completed by either square rooting, completing the square or factoring. Shows what the discriminant means and how the solutions/roots/ zeroes look on the parabola. This is one of the sections of the lesson review. See Quadratic formula notes for other methods & Solve by factoring notes for more resources! Used in Math 2 HS class
Subjects:
Grades:
7th - 12th, Higher Education, Adult Education
CCSS:
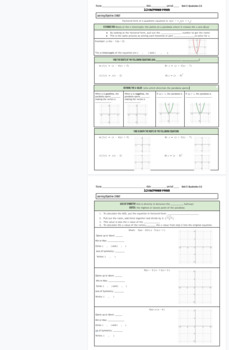
Factored Form of a quadratic equation scaffolded notes and graphing
Unit 3. 3.3 Factored form of quadratic functions. Students learn how the factored form of quadratic equations gives the solutions, zeroes, x-intercepts or roots of a parabola. They use different types fo factored equations to show 1 solution, 2 solutions. Google doc is editable. Graphic organizer. Fillable notes. KEY INCLUDED linked in title and on bottom of doc. Used in HS math 2 class. See 3.1, and 3.2 for previous lessons!
Subjects:
Grades:
7th - 12th, Higher Education, Adult Education
CCSS:
Also included in: Quadratic Forms & Characteristics Unit Notes & Homework
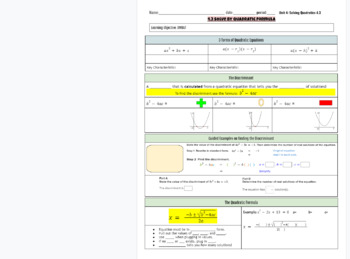
Solve quadratic equations by the quadratic formula fillable notes
Unit 4: 4.3 Solve by Quadratic Formula (See 4.1 and 4.2 for previous notes) fillable notes / graphic organizers. This is scaffolded and includes visuals of the graphs / solutions!. First students learn about finding the discriminant only by seeing the discriminant formula and telling how many solutions the answer gives. Then they use the quadratic formula to find the actual solutions along with the number of solutions. These fillable notes are on a google doc and editable. Used in HS math 2 clas
Subjects:
Grades:
7th - 12th, Higher Education, Adult Education
CCSS:
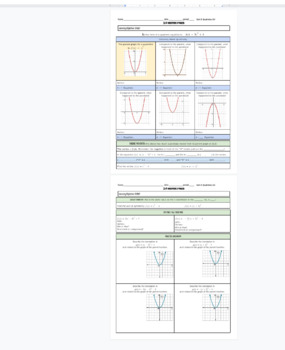
Vertex form of a quadratic equation (translations) scaffolded notes
Unit 3: Quadratics 3.4 Vertex Form of quadratic functions scaffolded notes / graphic organizer, fillable notes for class instruction. Students find the vertex in vertex form, and visually see how vertex form is translating the parent graph based on the h and k values. The warm-up helps students ease into the lesson by slowly moving the graph piece by piece. Google doc is editable and KEY IS INCLUDED on title and linked on bottom of the doc. See the 3.1, 3.2, and 3.3 notes for previous lessons!U
Subjects:
Grades:
7th - 12th, Higher Education, Adult Education
CCSS:
Also included in: Quadratic Forms & Characteristics Unit Notes & Homework
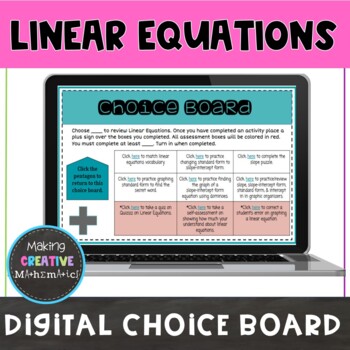
Linear Equations Choice Board
Want an engaging and interactive choice board where students practice graphing linear equations...This resource has students practice and review graphing linear equations. This linear equations activity allows for student choice. This choice board activity is a great way for students to practice during remote learning or in class. Students will use the interactive slides to practice and show their understanding of graphing linear equations. The slides provide interactive practice/learning as wel
Grades:
8th - 10th
Also included in: 8th Grade Math Choice Board Bundle

Pay It Forward Project (EXPONENTIAL GROWTH)
Students use the concept of "paying it forward" to gain real life knowledge/experience with exponential growth.
Resource includes a project checklist, planning sheets and preparation sheets so students can use Google Draw, Google Sheets and Google Docs to map their "paying it forward" idea, record and graph it in Sheets, then put it into action and journal how their action plan works!
Very basic, but very meaningful!
Subjects:
Grades:
7th - 10th
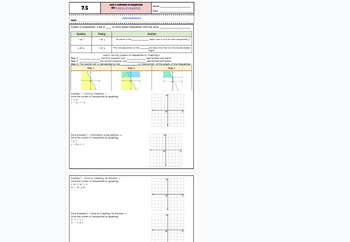
Graphing Systems of Inequalties Fillable Notes
Unit 7: Systems of Equations7.5 Systems of InequalitiesSWBAT solves systems of inequalities by graphing and shading two inequalities (linear) on the same plane. The double-shaded region is the solution area. Students need to put the linear inequalities into slope-intercept form and determine the characteristics befoe graphing.Intro video: link in the learning objectiveKey hyperlinked in the header and at the bottom of the doc as a PDFUsed in Math1 class.
Subjects:
Grades:
7th - 12th, Higher Education, Adult Education
CCSS:
Also included in: Inequalities Unit Fillable Notes & Key Only
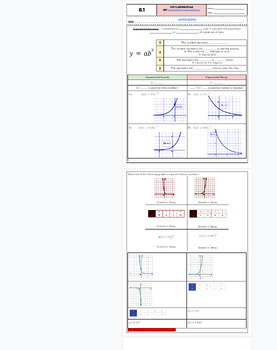
Characteristics of Graphing Exponential Functions Scaffolded Notes
UPDATED: Unit 8: 8.1 Graphing Exponential FunctionsStudents learn the characteristics of the equation of exponential functions and define all the variables to see the y-intercept, what makes it decay or grow, and the rate of decay and growth. The key is linked in the header as a pdf and also at the bottom of the google doc. Doc is editable to your liking. In their class practice, students learned to graph by plugging values into the formula from a table (this is not on the notes but it is explai
Grades:
6th - 12th, Higher Education, Adult Education
CCSS:

Scientific Graphing EDITABLE Google Slide Show with Keys and Doodle Note Sheet
This Slide Show does a wonderful job outlining key aspects of graphs including: Line and bar graphs, accurate titling, axis, and scaling. The doodle note sheet gives two examples of correct graphs, in addition to encouraging students creativity. It will help your students create their own graphs to represent their data in future experiments from start to finish.
Grades:
5th - 9th
Types:
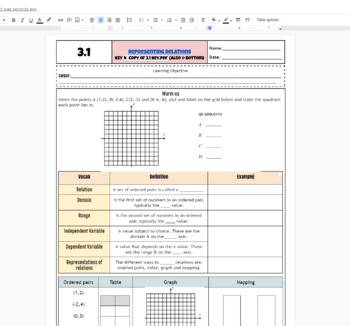
Representing Relations & Functions scaffolded notes: Mapping, table, graph
Math 1, Unit 3, 3.1 Representing Relations & Functions scaffolded notes: Mapping, table, graph. These lesson notes are an introduction into relations and functions. Many examples on how to graph points, what the graphs mean, and how to tell if and when a function occurs. Notes are scaffolded with practice. KEY IS INCLUDED in title and at bottom of the google doc. You can edit to your liking. Used in HS math 1 class.
Grades:
6th - 12th, Higher Education, Adult Education
CCSS:

Digital Graphing Templates
Blank templates ready for your graphing activities online. tally chartbar graphdouble bar graphpictographstem and leaf plot
Grades:
3rd - 6th
Types:
Showing 1-24 of 65 results


