243 results
High school graphing microsofts $5-10
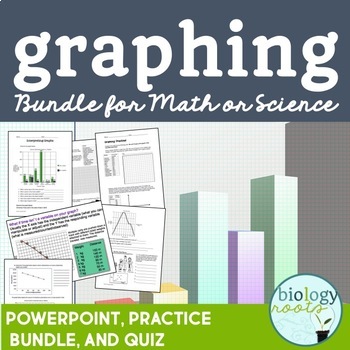
Graphing Bundle for Secondary
Complete and editable graphing bundle includes plenty of practice, editable PowerPoint notes to introduce or reinforce graphing concepts, as well as an assessment to finish it off! Suitable for grades 7 and up. Included in the package is:1. How to Interpret Graphs PowerPoint PresentationCovers line graphs, bar graphs, scatter plots and pie charts. Answers included on teacher version.Student notes included (PDF and PPT). 2. Interpreting Graphs- 3 pages of graph interpretation in which students an
Subjects:
Grades:
6th - 10th

Beaker Pong: Experimental Design and Graphing Lab, NGSS aligned
Great 1st week or 1st month STEM activity! All parts are EDITABLE and includes a graphing grid! This is a great way to introduce the "science process" (better phrase for scientific method) at the start of a semester or anytime you want fun to occur in your classroom.*****Focus on the NGSS PRACTICES Dimension*****The National Research Council's (NRC) Framework describes a vision of what it means to be proficient in science; it rests on a view of science as both a body of knowledge and an evidenc
Subjects:
Grades:
7th - 12th
Types:
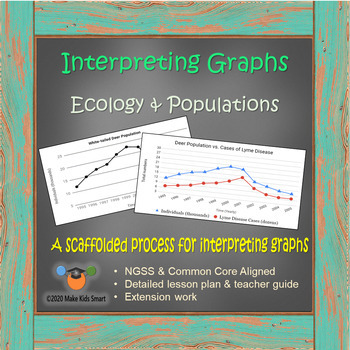
Interpreting Graphs - Ecology & Populations (17 slide Distance Learning Packet)
Teach students how to analyze and interpret line graphs, describe trends, and discuss data using a proven 5-step process. This is 2-3 periods of work suitable for distance learning and meant to move gradually from teacher led to independent work.All materials are found within this 17 page editable power point which is suitable for distance learning. Slides can be shared individually for student completion or shared as a full packet.Please check the preview to see exactly what you are downloading
Subjects:
Grades:
6th - 12th
NGSS:
HS-LS2-7
, MS-LS2-2
, MS-LS2-5
, HS-ESS3-2
, MS-LS2-4
...
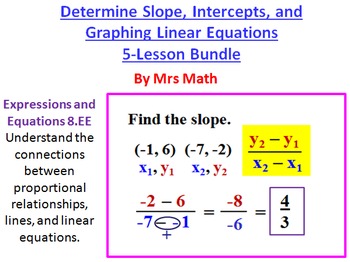
Slope, Intercepts, and Graphing Linear Equations Power Point 5 Lesson Pack
PDF and Microsoft word versions included.Are you looking for an all inclusive package that has everything you need to teach finding the slope, intercepts, and graphing equations? This is it! Lesson Power Points, classworks, homeworks, quizzes, a set of test questions, and even some teaching tips embedded in the lesson for instruction. If you are teaching this topic from scratch these resources will be a lifesaver. They can also be an excellent supplement to the resources you are already usin
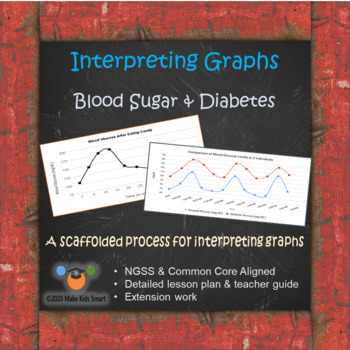
Interpreting Graphs - Blood Sugar & Diabetes (15 slide Distance Learning PPT)
Teach students how to analyze and interpret line graphs, describe trends, and discuss data using a proven 5-step process. This is 2-3 periods of work suitable for distance learning and meant to move gradually from teacher led to independent work. All materials are found within this 15 page editable power point which is suitable for distance learning. Slides can be shared individually for student completion or shared as a full packet.Please check the preview to see exactly what you are downloa
Grades:
6th - 12th
CCSS:
NGSS:
MS-LS1-2
, MS-LS1-3
, HS-LS1-2
, HS-LS1-3
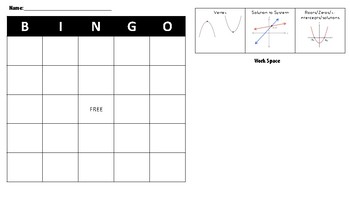
Algebra 1 EOC STAAR Review BINGO Game
Fun and interactive Bingo game is the perfect activity for the days leading up to the Algebra 1 EOC or as cumulative review throughout the year. This game is designed for scholars to solve questions by graphing on calculators as review before their EOC exam however answers can be found a variety of ways. The game includes the following topics:1. Finding Vertex of Quadratic Parabolas 2. Finding the Roots/Solutions of Quadratic Functions3. Finding the Solution to a System of Equations4. Finding t
Subjects:
Grades:
8th - 10th
Types:
SCIENCE STATIONS: GREENHOUSE EFFECT (Great for Observations!)
Learn all about the Greenhouse Effect with this in depth Station Activity. I have used these stations two ways: 1) As true stations where the students rotate. 2) Each station completed on a separate day. I use the coordinate graphing as an extra. Students bring it with them to every station and if they finish early they have something to do.
Station 1 - Informational Text - Read informational text about the Greenhouse Effect. Answer the questions that follow in complete sentences.
Sta
Subjects:
Grades:
5th - 10th
Types:
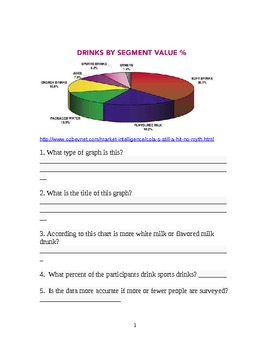
Charts and Graphs for Middle School
Included are thiry-eight graphs, charts, maps, flowcharts, tables and other graphics. These are real data maps taken from the Internet (all sources noted). Under each graphic are five questions that can be answered by using the information provided. The questions range from titles, mean, meadian, to create your own graph.
The pages can be copied back to back to make a workbook. I use this workbook as bellwork while I am taking attendance. Everyday the students answer the question. (I requi
Subjects:
Grades:
6th - 9th
Types:
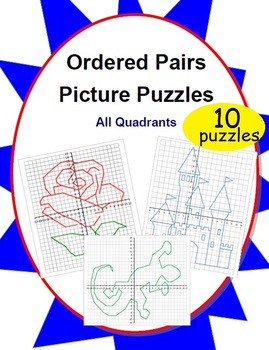
10 Ordered Pairs Mystery Picture Puzzles (All Quadrants)
10 original pictures perfect for any order pair puzzler. Start simple with a continuous connect-the-dot picture and graduate to more complex pictures composed of multiple sections. The built-in self-checking nature of creating a picture makes it easy for students to immediately assess their own progress.This 15-page PDF file includes:- 10 reproduction-ready original picture puzzles- An illustrated key so teachers can select appropriate puzzles based on student skill level and intended use- Numbe
Grades:
4th - 10th
Types:
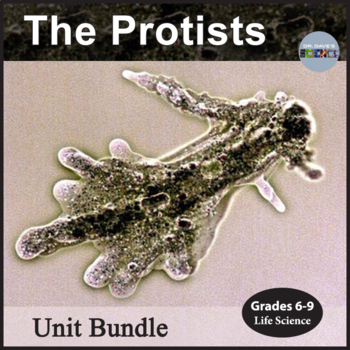
Protists Unit Bundle Protista Kingdom
This unit bundle contains both a 75-slide Protist PowerPoint as well as 19-page activity packet for the Protists. You receive a 20% discount on both resources when you purchase this bundle. Please click on the individual resources for more information. Terms of UseCopyright © Dr. Dave's Science. All rights reserved by author. This product is strictly for individual use and may not be copied or given to other teachers. Copying any part of this product and placing it on the Internet in any form (
Grades:
6th - 9th
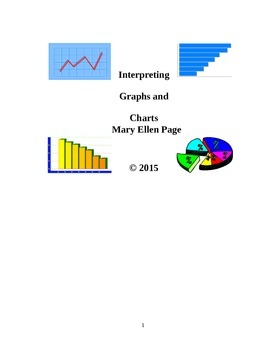
Interpreting Graphs and Charts
Students work with a variety of 25 graphs and charts and learn how to interpret the information provided. The format varies from one to the other: pie, column bar, horizontal bar, line/dot, and picture (volcano) graphs and table charts. Appropriate for math, Social Studies, ELA, ESL, and Spanish culture. Can be used in Gr. 6-12, adult education, college, and home school. All answer keys provided.
Grades:
6th - 11th, Higher Education, Adult Education
Types:
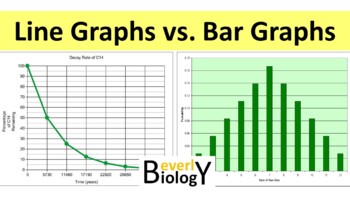
How to Make a Graph PowerPoint: Bar vs Line Graphing
This PowerPoint explains the basic properties of a line graph verses a bar graph. There is also a free handout included for your students to use as you present the lesson.This is NOT the typical bullet point PowerPoint. This is very much an animated, multimedia presentation filled with engaging images and animations to better enhance learning. Better yet! You can preview this entire PowerPoint prior to purchase on my YouTube channel to make sure it suits your needs:Preview on YouTubeThere are 3
Subjects:
Grades:
6th - 12th
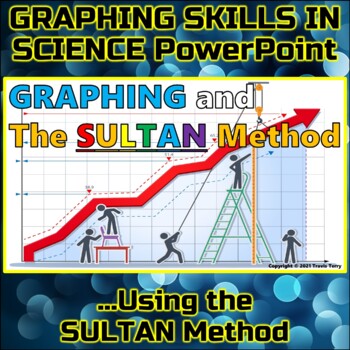
PowerPoint: Graphing Skills in Science PP Pack
Do your students struggle with understanding and creating decent graphs in science class? Look no further!A great PowerPoint presentation with LOTS of visuals and to-the-point explanations! The focus of this presentation is why graphing is important in Science and the steps used to create good looking, easily read graphs to present data clearly. Includes clean animations, pictures, and two videos to help students understand how to graph properly!The black background of the PowerPoint creates an
Subjects:
Grades:
6th - 9th
Graphs Power Point
This is a 42 slide Power Point presentation on Graphs. It includes information on the following types of graphs: tally chart, line plot, pictograph, bar graph, histogram, coordinate graphs and ordered pairs, line graph, and a stem and leaf plot. Information on these graphs includes an explanation, several examples, questions on graph examples, information given so students can create their graphs, etc. There is also information on Surveys including population, sample, representatives, not rep
Grades:
3rd - 9th
Types:
Bundle Ecuación Lineal
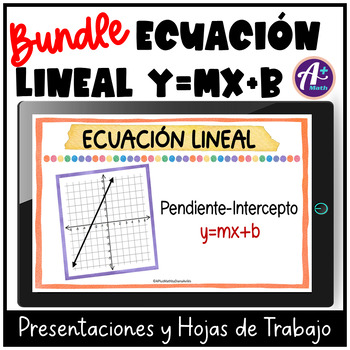
Ecuación Lineal El recurso trabaja los siguientes temas:Primera Parte•Definición de ecuación lineal•Identificar si una ecuación es lineal•Identificar si un par ordenado es solución•Explicación de la ecuación pendiente-intercepto y=mx+b•Definición de la pendiente y tipos•Definición del intercepto en y•Graficar utilizando tabla de valores•AplicacionesSegunda Parte•Definición de ecuación lineal, pendiente e intercepto en y (repaso)•Explicación de la ecuación pendiente-intercepto y=mx+b (repaso)•Hal
Grades:
7th - 9th
Exponential Growth & Decay Functions Calculation & Graphing Project
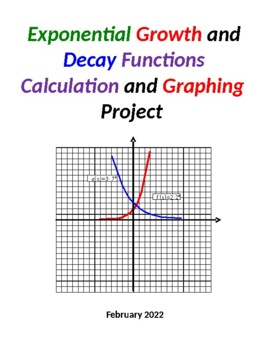
PLEASE NOTE: THE PREVIEW VERSION OF THIS PRODUCT IS THE ACTUAL "STUDENT VERSION" AND DOES NOT INCLUDE ANY OF THE ANSWERS TO THE PROBLEMS. THE "PRODUCT VERSION" INCLUDES DETAILED ANSWERS TO ALL OF THE PROBLEMS FOR THE PROJECT.This activity involves the calculation, graphing and coloring of exponential growth and decay functions. I have my Algebra 1/Math 1/Math 2 students complete this project toward the end of the unit on exponential functions.A total of five (5) exponential growth functions a
Subjects:
Grades:
8th - 10th
CCSS:

Scatter Plot and Bivariate Data Research Project
Students will begin a statistics project on one of their favorite restaurants or food chains! They will be researching nutrition facts and surveying others on what types of food they like to eat there. Through this data collection they will work on their skills of creating scatter plot graphs, creating relative frequency tables, and analyzing this data. This can be used either by paper or digitally. I used it the last two years during distance learning. Rubric included.
Subjects:
Grades:
7th - 12th
Types:
Tables, bar charts, and graphs - how to construct them in order to present data
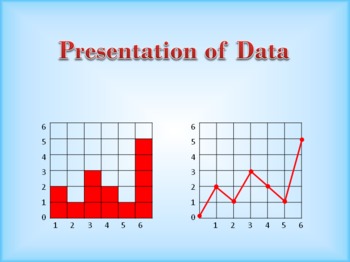
By the time students reach middle school, they have learned how to fill in the data on a table, bar chart, and graph, but they still need to learn how to create (construct, make, or draw) one from scratch. This is a PowerPoint presentation, with lecture notes and associated worksheets, that demonstrates how to present data clearly, by constructing tables, bar charts, and graphs from raw data. It covers topics such as the relationship between independent and dependent information (variables), a m
Subjects:
Grades:
7th - 10th
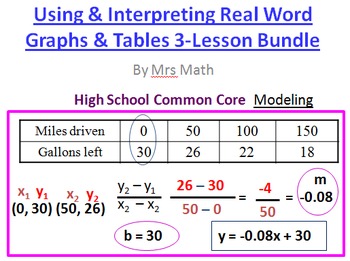
Interpreting and Using Real World Graphs & Tables Power Point 3-Lesson Pack
PDf and Microsoft Word versions included.Looking for an all inclusive package that has everything you need to give students a thorough understanding of real world graphs and tables? This is it! Students determine the rate of change, understand what the x & y –intercept mean, write equations, and use those same equations for making predictions. Lesson Power Points, classworks, homeworks, quizzes, a set of test questions, and even some teaching tips embedded in the lesson for instruction.
Grades:
7th - 10th
Geographical Features of Earth - PowerPoint and Activities
Great science unit on describing geological features of Earth, including bodies of water, beaches, river, lakes, ocean ridges, continental shelves, plateaus, faults, canyons, sand dunes, island, peninsula, mountains, hills, plains, plateaus, and ice caps.
All taught with a PowerPoint and printable that go along with it to make sure the students understand objectives above. If you have this objective in your state. You can cover it with this PowerPoint and activity sheets very easy! I love easy
Subjects:
Grades:
3rd - 9th
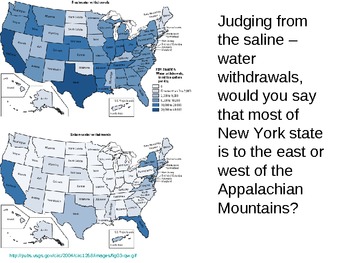
graphing bellwork for jr. high
This is a PowerPoint with a separate slide for each day of school. There is a graph that stays consistant for the entire week. One new question is presented regarding the specific graph. I created this presentation to be used as bellwork for jr. high students, including special education students. The questions are designed to help meet the weaknesses in univariante data shown by our MEAP scores. Answers are located in the notes part of the presentation, so you can print off an answer key.s
Subjects:
Grades:
6th - 9th
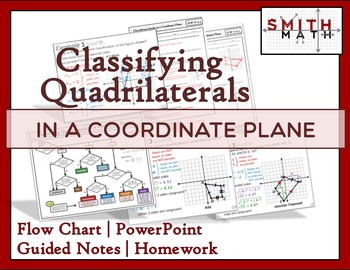
Classifying Quadrilaterals PowerPoint Lesson
This lesson and its accompanying resources were developed to help students classify quadrilaterals in a coordinate plane. This lesson is built around a flow chart. Flow charts in general help students think through complicated ideas, and exposure to them in high school will prove useful for those who later enter fields like engineering and computer science. Included in this resource:1) Flow Chart, which is available as a free resource (Classifying Quadrilaterals Flow Chart)2) A PowerPoint, comp
Grades:
9th - 12th
Desmos Graphing Project (Review)
This project is meant as a review of linear functions as well as transformations in the coordinate plane (translations, reflections, rotations, dilations). Students get to choose which transformation to perform, so it does not "review all transformations". Students use Desmos to outline a letter, usually an initial, (restricting domain and range) and then transform it within Desmos (in a table). For easier projects: pick transformations for students to perform (translations, dilations) and walk
Grades:
8th - 12th, Higher Education, Adult Education
Geometry PowerPoint Unit Bundle | Tools of Geometry DISTANCE LEARNING
Teachers, save yourself time creating lessons! This fully editable PowerPoint bundle of six lessons is professionally designed and teaches students the important foundations of Geometry. This bundle includes six lessons for a total of 59 animated slides encouraging continued student engagement.Essential Skills from this unit:sketch using appropriate markingsinterpret sketches and markingsunderstand accurate definitionsunderstand the relationships between basic angle pairsapply algebra to interpr
Grades:
7th - 10th
Showing 1-24 of 243 results


