5 results
Graphing simulations $10 and up

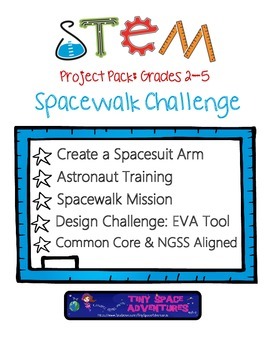
STEM Spacewalking Challenge Project Pack: Grades 2-5
STEM Spacewalking Challenge Project Packby Tiny Space AdventuresGet ready for some teamwork, higher level thinking, problem solving, engineering design and FUN, HANDS-ON LEARNING at its best!This lesson uses the STEM 5-E Instructional Method: Engage, Explore, Explain, Elaborate and Evaluate. Rubric includedStudents will:Create a replica of the spacesuit arm & gloveConduct astronaut hand physical training exercises and strength test.Fill out Astronaut Reports and graph results of strength te
Subjects:
Grades:
2nd - 5th
Types:

Calculus Bundle of Interactive Graphing Apps plus software
Your Calculus students will love these interactive simulations and demonstrations of graphical calculus. These Dynamic moving 3D graphs will help your Calculus students visualize the concepts you teach. Engaging and so easy to use, you will be demonstrating important concepts in AP Calculus AB, BC, Honors or traditional Calculus 1 and 2 in minutes. Project from your computer onto a screen or whiteboard. No internet needed.There are 14 Applets Included: ✓ Animated End Behavior ✓ Animated Functio
Grades:
11th - 12th, Higher Education
Types:

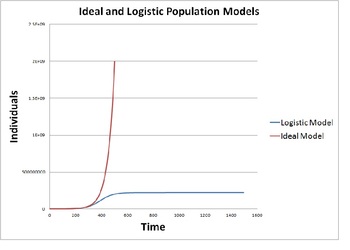
Modeling Population Growth (Ideal vs. Logistic Model)
This activity provides instructions to construct a mathematical model on a blank spreadsheet that simulates population growth using an ideal model and a logistic model. The activity provides background discussion and then gives instructions on how to program a spreadsheet to produce and display the ideal and logistic population models. Their results are studied for various cases including human population, rabbits, polar bears, bacterial and yeast colonies.
This quantitative population model
Subjects:
Grades:
9th - 12th, Staff
Types:

Data Handling: Traffic Nightmare Tally and Bar Charts Project
A fantastic and very comprehensive resource including a Traffic Nightmare project book, lesson plan, student objective sheets, PowerPoint extended data collection exercise, PowerPoint Tally Chart Bingo, student bingo sheet and a PowerPoint introduction to using tally charts.
This project focuses on a scenario where the opening of a local supermarket has resulted in a great increase in heavy traffic through a residential area. The students tally the vehicles they see on screen to 'prove' the incr
Subjects:
Grades:
Not Grade Specific

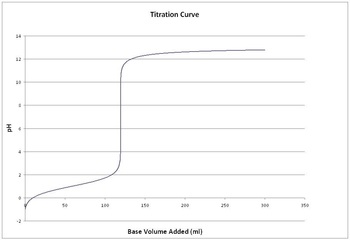
Simulating Titration of Acid on a Spreadsheet
This activity guides students to construct a spreadsheet from a blank Excel workbook that will simulate titration of acids or bases.
*Teacher background on Excel is not required*
After constructing the spreadsheet and graphs the students will experiment with the spreadsheet to answer analysis questions that will help students learn the mathematical nature of titration (solutions are provided including descriptions of all spreadsheet manipulations necessary to solve each problem).
The va
Subjects:
Grades:
10th - 12th, Higher Education
Types:
Showing 1-5 of 5 results


