71 results
Middle school graphing research
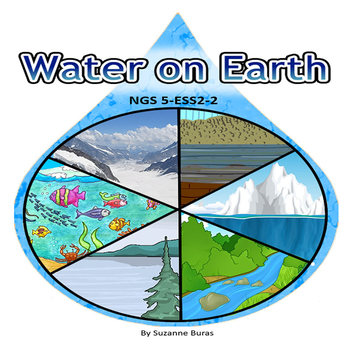
NGS 5-ESS2-2 Water on Earth
This product provides supplemental resources that address concepts related to describing and graphing the amounts and percentages of water and fresh water in various reservoirs to provide evidence about the distribution of water on Earth.The product includes the breakdown by percentages of the categories of water found on earth. It further breaks down each category into subcategories. For each, students are asked to graph the percentages. There is also a research opportunity related to drink
Subjects:
Grades:
4th - 6th
Types:
NGSS:
5-ESS2-2
Also included in: Next Generation Science: Earth Science Bundle 5-ESS1-3
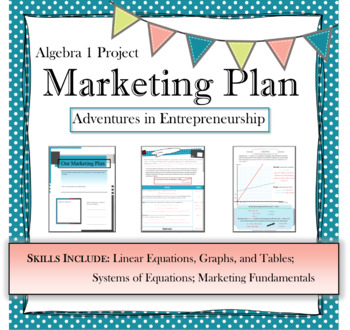
Algebra Marketing Plan PBL | project based learning | real world Math
This Project Based Learning activity will help Algebra 1 students practice setting up and solving systems of linear equations within a real world context. As they take on the role of an entrepreneur, they will write equations, plot coordinate points, graph equations, analyze data, and draw conclusions. This can be used as a group project or individual project and would work great for an end of unit review. ------------------------------------------------------------------------------------------
Subjects:
Grades:
7th - 12th
CCSS:
Also included in: Math Algebra 1 BUNDLE projects, activities, notes, and more
Create a Survey - Research Skills
Scaffolded printables to guide every step of the survey process! Can be used for ANY survey design. Designing a survey is an exciting way for students to conduct research and discover information about a group of people. Throughout the survey process, students have an opportunity to be creative, engage in problem solving and develop critical skills in analytical thinking. A powerful data-gathering tool, surveys are a thought-provoking and dynamic method of research that students love to engage
Subjects:
Grades:
5th - 8th
Types:
Iditarod Student Packet - Daily Tracking (Data Collection, Map Skills, Research)
Iditarod Student Packet - Daily Tracking (Data Collection, Map Skills, Research)This is the page for the previous OLDER version. If you purchase this product you are buying an older version.Click on the link below to be directed to the NEWER, UPDATED, EDITABLE version of this product:https://www.teacherspayteachers.com/Product/Iditarod-Student-PktDaily-Tracking-UPDATE-Data-CollectionMap-SkillsResearch-9140503This is a great resource for students who are interested in learning more about The Last
Subjects:
Grades:
3rd - 7th
Types:
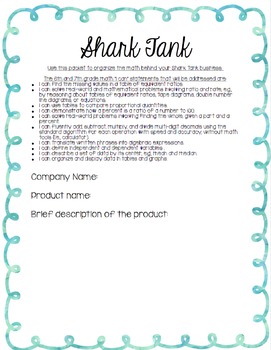
Shark Tank Project
Based on the hit show Shark Tank, students will create a product and business plan to pitch to the "Sharks". This product comes complete with the student packet, certificate for students, questions/script for the sharks, and teacher hints for how to make this a hit!All tasks within the project are connected to 6th and 7th grade CCSS math standards. "I Can" statements are provided in the student packet.Students will:-Create a company name and product-Determine the cost per product to make-Determi
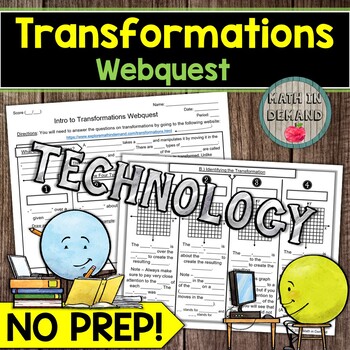
Transformations Webquest Reflection Rotation Translation Dilation
Students will need a device for my math webquest on transformations. Students will be given a link that goes to my website containing information about reflections, rotations, translations, and dilations. Students will learn how to: (1) identify a transformation, (2) perform a transformation, and (3) use the transformation rules to give the coordinates of an image. I have included a worksheet that aligns to the information on my website. All you need to do is print and go! In addition, there is
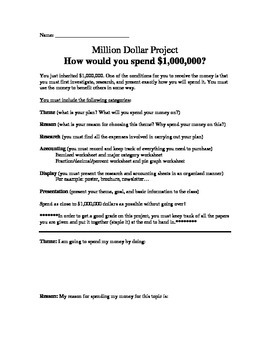
Million Dollar Project (Graphing, decimals, fractions, accounting and percents)
What would you do with a million dollars? How would you spend it?
In this project you've been left a 1 million dollar inheritance. The catch is you must first research and present how you will spend the money.
In the first part of the experiment, the students will fill out an accounting chart, where they will fill out an itemized chart displaying each item they plan on purchasing to complete their million dollar project. They will than be asked to put all those items into major categorie

Scatter Plot and Bivariate Data Research Project
Students will begin a statistics project on one of their favorite restaurants or food chains! They will be researching nutrition facts and surveying others on what types of food they like to eat there. Through this data collection they will work on their skills of creating scatter plot graphs, creating relative frequency tables, and analyzing this data. This can be used either by paper or digitally. I used it the last two years during distance learning. Rubric included.
Subjects:
Grades:
7th - 12th
Types:
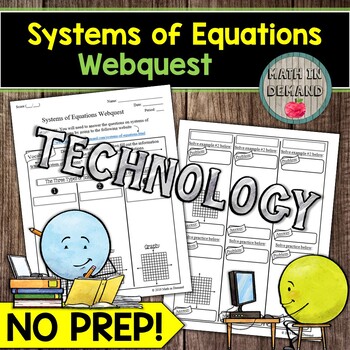
Systems of Equations Webquest Math
Students will need a device for my math webquest on systems of equations. Students will be given a link that goes to my website containing information about the number of solutions (no solution, one solution, and infinitely many solutions), and how to determine the number of solutions by using graphing, substitution, and elimination. I have included a worksheet that aligns to the information on my website. All you need to do is print and go! In addition, there is a 10 problem quiz on my website.
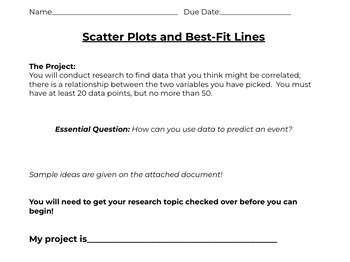
Scatter Plots and Lines of Best Fit - PROJECT BASED LEARNING
MATH with MANNIXProject Based LearningSWBAT research their own topic to see if there is a correlation.SWBAT gather their own data and create scatter plots and lines of best fitSWBAT interpret and describe their findingsSWBAT analyze classmates findings GoogleDrive- Includes GoogleSlides and GoogleDocsCan be used for individuals or groups!What is included...Outline of projectRubricData SheetsSentence Starters/Why we write in math docGoogleSlide TemplateClassmate Reflection sheetConstruct and int
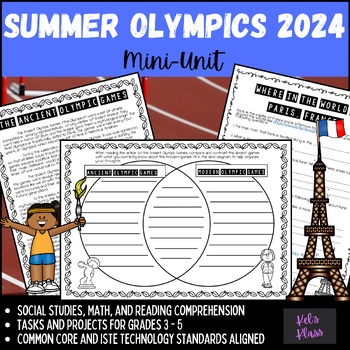
2024 Summer Olympic Mini-unit (Paris, France)
Welcome to the 2024 Summer Olympic Games in Paris, France! Seven activities are included, bringing together reading, math, social studies, technology production (not just consumption), and product presentation all centered around the history of the games and especially the 2024 Summer Olympic Games in Paris! Students will compare and contrast the modern Olympic games with the Ancient Olympics, as well as dig into what the background of the various parts of the Olympics themselves. Research focus
Grades:
3rd - 6th
2021 Summer Olympic Athlete Research - Independent Study Project and Booklet
*UPDATED for 2021 OLYMPIC GAMES!Your students will love doing easy research on their favorite athletes from the Summer Olympics! THIS PRODUCT INCLUDES THE NAMES OF 60 OLYMPIC QUALIFIERS FROM THE USA FOR STUDENTS TO WATCH FOR AND RESEARCH.In this product you will find directions and templates for using the www.teamusa.org website to research Olympic athletes.Students can use the collected research to create a class (or individual) book reviewing these successful athletes. An additional option wou
Subjects:
Grades:
2nd - 6th
Types:
Weather Tracking in Excel
Compatible with Google Sheets, Google Classroom, or as a stand-alone file on a PC, this product is a must have for any teacher comparing weather conditions in multiple locations!
BEFORE YOU BUY: This file is part of a larger unit. Save yourself money by purchasing the Super Science Set for Weather and Climate nstead of buying each file separately.
Purchased alone, you get:
⭐ An Excel workbook that enables students to track the weather for 5 different locations as a whole class or individ
Subjects:
Grades:
4th - 8th
Types:

Hurricane Project
This is a great project for students to understand hurricanes to the full extent. We would study hurricanes over a few weeks showing students videos, data, going to the National Hurricane Center website, giving them the opportunity to learn how to plot coordinates and track them. They will understand the damage that can be done and who is called in after a hurricane has hit and the help the city will receive. They will create a hurricane from start to finish, choosing a name based on the month o
Superbowl Statistics, Graphing Project with Writing Prompt 3-5
****NEWLY UPDATED*****
This project has students selecting a team that will win the Superbowl, then using statistics from the season and graphing to PROVE their team will win. The document lists requirements, types of graphs and ideas for ways to show data with the team's season statistics. Teachers/students will need to go to the NFL website and research the statistics. Teachers could also print these off for teams to use.
The second half of the project has been added in support of CCSS. Stude
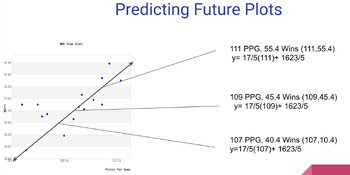
Scatter Plot Project on Desmos with Template
Learners will work to collect their own data from something they are interested in. They will then create a scatter plot using Desmos.com and analyze the information they collected. The analysis includes drawing their own trend line, finding the equation of that trend line, and predicting 3 values outside their original data collection. There are detailed directions with screenshots included along with a Google Slides template that can be shared with learners to help them organize their work. I
Subjects:
Grades:
7th - 9th
Types:

Classroom Stockmarket Challenge Project
This project is a real-life example of using percent of change and graphing. The beauty of this project is that it can be done with computers if available or just paper and pencil. It can be used to teach percent of change, graphing, interpretation of data, finance and business. The project can be used as a blank day (at end of unit) or end of year project. I have used it with 7th grade Advanced Math and 8th graders in Pre-Algebra.Other Projects you may be interested in:Circle Graphs using a Spo
Create Your Own City/Town with a Coordinate Plane
Finish your unit on coordinate planes with a project! Using only quadrant 1, students will learn all about map making, graphing points on a coordinate plane, and creating questions based on points on the coordinate plane. Included are:-A PowerPoint embedded with videos, notes, and directions for the project-A packet is linked on the first slide with directions, rough draft paper, worksheets, final copy paper, and a rubric!Use this interdisciplinary project today to better students' understanding
PyeongChang 2018: A Journey to the Winter Olympics
Most students have little interest or connection to the Winter Olympics. This complete unit will take them on a journey to the 2018 PyeongChang South Korea Winter Olympics as an athlete for a country of their choice to compete in an event of their choice. This is written for students to research and reflect on the Winter Games. Directions to all activities and internet resource links are provided.
Student Component/ Activity directions include:
Reading with Reflection Questions (Olympic M
Grades:
4th - 7th
Types:
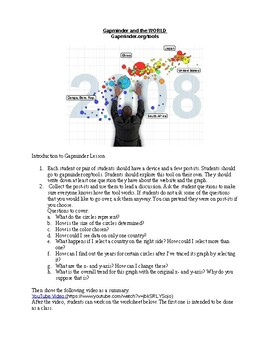
Gapminder and the World Activity
Students use gapminder.org/tools to discover the relationships between various historical factors and the population of many countries over time. This lesson connects history with linear relationships. It is a great way to add context to graphs and help students apply their math knowledge in a unique cross-content way.
Subjects:
Grades:
8th - 12th
Types:

Facts About Endangered Species - Bar Graph and Data Analysis
Complete independent study and activity to bring awareness to endangered species. Students get introduced to the Endangered Species Act, answer questions, create a graph based on data provided, and prepare a PowerPoint presentation on a species of their choice. This is a complete activity where students are engaged and practice their analysis and graphing skills. They take ownership of their work by selecting the subject of their research and presenting their report to the group. This is a ve
Subjects:
Grades:
5th - 8th
Math- When Will I Ever Use This? Finding Math in Everyday Life
Research and record how you and others use math every day. You will conduct a survey, analyze your data, and create graphs. You will begin to appreciate how math is embedded in many aspects of our lives.This math Exploration includes detailed, student-friendly Steps to Success that lead the learner through the process of creating a high-level, quality independent project. To add rigor and thoughtfulness, students reflect on their Exploration by answering standards-based Questions of Mathematical
Subjects:
Grades:
3rd - 8th
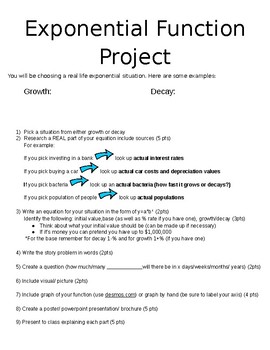
Exponential Function Real Life Project
Students pick an exponential growth or decay situation and research real life rates or values. Furthermore, they create an equation, write a story problem, ask and answer a question, create a graph and present a powerpoint or poster about their exponential situation.
* Note blank space under growth and decay is meant for a whole class brainstorm about the different scenarios they can think of.
Subjects:
Grades:
8th - 12th
CITY GRAPHING PROJECT
City. Cities Research. Graphing Analysis. Intercultural Awareness.The city graphing project serves two purposes. The written portion of the project helps to create intercultural awareness of different cities in the world and the graphing portion allows students to graph authentic data. Two sets of data are graphed with 2 different types of graphs and students critique in the conclusion which graph was best suited to display this type of data. Questions and a graphic organizer is included to
Subjects:
Grades:
5th - 8th
Showing 1-24 of 71 results


