5 results
Higher education graphing research

6 Editable Bar Graph Templates 2.0
Finally a simple and professional graph space that students can fill out without any design issues getting in the way. This file contains 6 ready-to-use graph options. Print them and have students fill them with pencil and ruler, or distribute them over computer and let them practice entering the data. Get a project perfect finish every time. Maybe you just want to fill it out live on a projector? The possibilities are endless! It's okay to say you love these bar graphs. So do we.Contains:- 2 bl

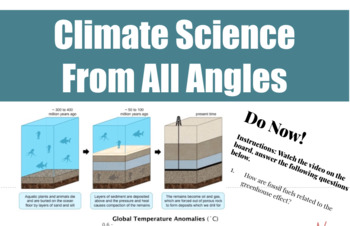
Climate Science From All Angles
Great for remote instruction! Bring your Earth science students' active knowledge of climate to a whole new level with multi-modal activities in "Climate Science from All Angles." These sequenced approaches to building scientific-literacy incorporate current news, graphing, argumentation, and scaffolded methods for writing scientific explanations. Where Science and Literacy Meet! learnmore@stemjourneys.org.
Subjects:
Grades:
5th - 12th, Higher Education, Adult Education, Staff, Not Grade Specific
Types:
CCSS:
NGSS:
MS-ESS3-2
, MS-ESS3-5
, MS-ESS3-3

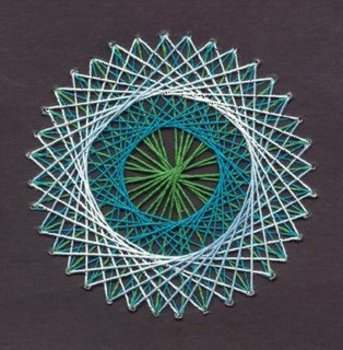
IB-Extended Essay Suggestion: The Mathematics of String Art
This document provides ideas for an extended essay investigation into the maths of string art. Ideal for International Baccalaureate Extended Essays

Duckweed Independent vs Dependent Growth Experiment and Paper
This is a fun lab experiment that I do with my sophomore biology students during our ecology unit. The students each have their own samples of duckweed (Lemna minor) and collect data over 2-3 weeks. They write a scientific paper afterwards. I have included basic lab instructions, student paper instructions, a spreadsheet that the students can put their collected data into, and a grading rubric. Edit the documents as needed for your class.
Grades:
10th - 12th, Higher Education
Types:
NGSS:
HS-LS2-1

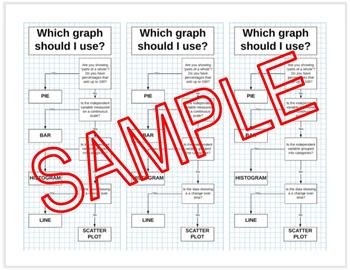
WHICH GRAPH SHOULD I USE? - Graphing - Math - Science - Interactive Notebook
Have trouble teaching students which graph is appropriate? This is the resource for you.
As you can see from the preview the branching tree walks students through 4 simple questions that will lead them to the correct graph. Graphs included in the resource are; bar, line, scatter plot, histogram, and pie chart. This PDF is formatted to print 3 slips er 8 1/2 by 11 page. These are the perfect size for bookmarks or for interactive notebooks.
Showing 1-5 of 5 results


