51 results
High school graphing research for Microsoft OneDrive

Exponential Functions Introduction Activity in Digital and Printable
Engage students with this intro lesson that will get them thinking exponentially.Included in download:Would you rather? Choices to get students thinking (PDF and Google Forms Poll included)Table and Graph for students to explore linear vs. exponential results of the given choices (printable PDF, Google Sheets, and Microsoft Excel versions included)Answer KeyExponential functions are a difficult concept for students because they are used to thinking about linear relations. Before telling students
Grades:
8th - 9th
Types:
CCSS:
Also included in: Algebra 1 Discovery Lessons and Inquiry Activities Bundle
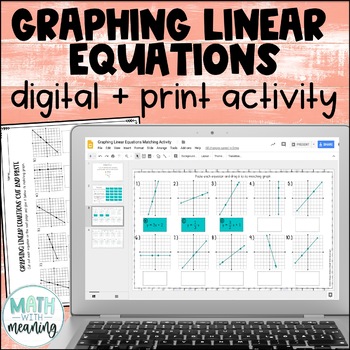
Graphing Linear Equations Digital and Print Activity for Google Drive
Looking for an engaging, no-prep activity to practice matching linear equations to their graphs? Students will match 20 equations to their graphs with this fun digital and print activity. Many of the equations are very similar and involve the same numbers, so students will need to work carefully!All equations are written in slope-intercept form. The graphs include positive, negative, zero, and undefined slopes. Please view the preview file to make sure that this activity is appropriate for your
Grades:
6th - 9th
CCSS:
Also included in: Middle School Math Digital and Print Activity Bundle Volume 2
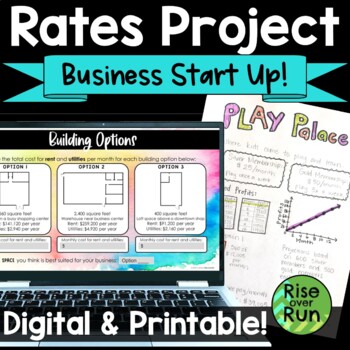
Rates & Proportional Relationships Real World Project
Students work with real world rate of change and proportional relations as entrepreneurs creating a business startup! They will love getting creative, and you will love that everything is ready to go to get them thinking about math. This project is included in printable PDF version, Google Slides, and PowerPoint.In this project, students get creative as they decide on a type of business, membership fees, and a building location. Then they must calculate their costs and profits based on those dec
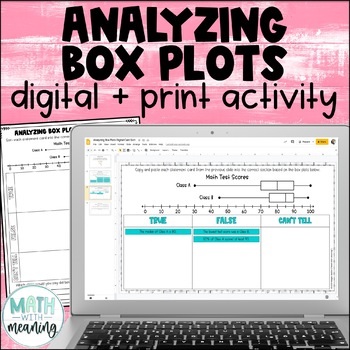
Box and Whisker Plot Digital and Print Card Sort - Reading and Analyzing
Looking for an engaging, no-prep activity to practice reading and analyzing box plots? Students will look at a double box plot and determine if statements about it are true, false, or if they can't tell from the information given in this fun digital and print activity.This activity includes statements about the minimum, maximum, median, quartile 1 (Q1), quartile 3 (Q3), interquartile range (IQR), and range of the box plots, along with statements about the percentages represented by a particular
Subjects:
Grades:
6th - 9th
Also included in: Middle School Math Digital and Print Activity Bundle Volume 3
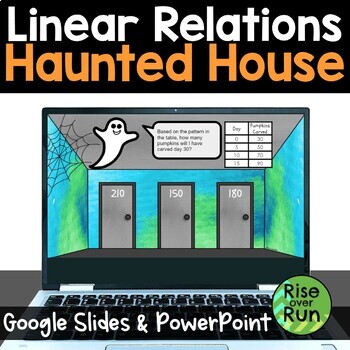
Digital Linear Relationships Halloween Escape Room Activity
Students will love this engaging practice activity for linear relationships. They must try to escape a haunted house! Includes Google Slides and PowerPoint versions. They are given 14 problems to solve, choosing from 3 possible answers for each one. If they solve correctly, they will choose the correct door and avoid the scary giant spiders! If they make a mistake, a spider appears, and they are prompted to try again. Problems include linear graphs, table of values, equations, and stories. Thi
Grades:
7th - 9th
Types:
CCSS:

Algebra Marketing Plan PBL | project based learning | real world Math
This Project Based Learning activity will help Algebra 1 students practice setting up and solving systems of linear equations within a real world context. As they take on the role of an entrepreneur, they will write equations, plot coordinate points, graph equations, analyze data, and draw conclusions. This can be used as a group project or individual project and would work great for an end of unit review. ------------------------------------------------------------------------------------------
Subjects:
Grades:
7th - 12th
CCSS:
Also included in: Math Algebra 1 BUNDLE projects, activities, notes, and more

Slope Digital Math Escape Room Activity for Halloween
Students will love this fun practice activity for calculating slope between 2 points. Answering correctly will help them escape a haunted house! Includes Google Slides and PowerPoint versions. They are given 14 problems to solve, choosing from 3 possible answers for each one. If they solve correctly, they will choose the correct door and avoid the scary giant spiders! If they make a mistake, a spider appears, and they are prompted to try again. For each problem, students are given two ordere
Grades:
7th - 9th
Types:
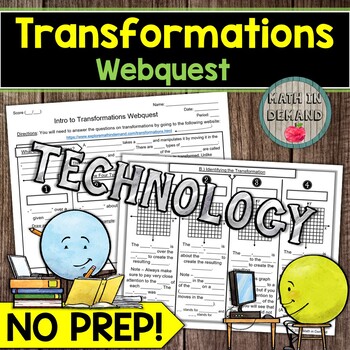
Transformations Webquest Reflection Rotation Translation Dilation
Students will need a device for my math webquest on transformations. Students will be given a link that goes to my website containing information about reflections, rotations, translations, and dilations. Students will learn how to: (1) identify a transformation, (2) perform a transformation, and (3) use the transformation rules to give the coordinates of an image. I have included a worksheet that aligns to the information on my website. All you need to do is print and go! In addition, there is
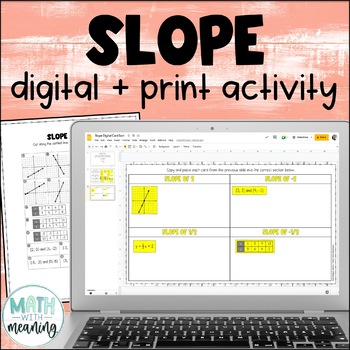
Finding Slope from Graphs, Tables, Equations, and Points Digital Card Sort
Looking for an engaging, no-prep activity to practice finding the slope when given a graph, equation, table, or two points? Students will sort 22 cards based on their slope in this fun digital and print card sort activity.Each problem gives either a table, a graph, two points, or an equation in slope-intercept form and asks students to find the slope. Please view the preview file to make sure that this resource is appropriate for your students.This product includes the following:A link to the ac
Grades:
6th - 9th
Also included in: Middle School Math Digital and Print Activity Bundle Volume 3
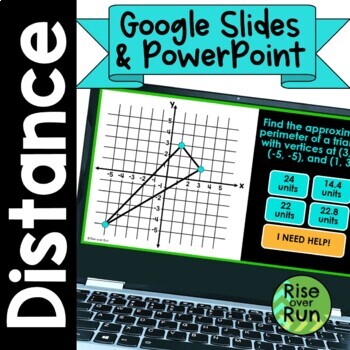
Distance Between 2 Points Practice PowerPoint & Google Slides
Students use the Pythagorean Theorem to find distances between points on a coordinate grid in this no-prep, self-checking activity. Four types of problems are included:Distance between 2 points on a graphDistance between 2 points sketched (for large numbers)Perimeter of polygons on a graphReal world map application problemsSolutions are in the format of whole numbers, decimals, roots, and rounded approximations. Problems range from very basic to challenging!16 problems are included. Each one is
Grades:
8th - 10th
Types:
Also included in: 8th Grade Geometry Unit Activities and Lessons
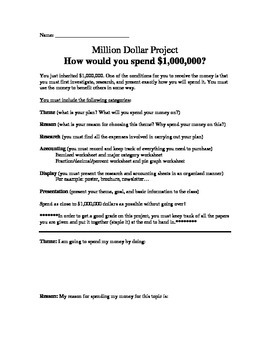
Million Dollar Project (Graphing, decimals, fractions, accounting and percents)
What would you do with a million dollars? How would you spend it?
In this project you've been left a 1 million dollar inheritance. The catch is you must first research and present how you will spend the money.
In the first part of the experiment, the students will fill out an accounting chart, where they will fill out an itemized chart displaying each item they plan on purchasing to complete their million dollar project. They will than be asked to put all those items into major categorie

Scatter Plot and Bivariate Data Research Project
Students will begin a statistics project on one of their favorite restaurants or food chains! They will be researching nutrition facts and surveying others on what types of food they like to eat there. Through this data collection they will work on their skills of creating scatter plot graphs, creating relative frequency tables, and analyzing this data. This can be used either by paper or digitally. I used it the last two years during distance learning. Rubric included.
Subjects:
Grades:
7th - 12th
Types:
Digital Mad Lib Math Activity - Identify Slope and Y-Intercept from a Graph
No prep. No paper. No materials. Totally digital. Great for Distance Education, 1:1, BYOD, or math computer centers. Google Drive, Google Classroom, and Microsoft One Drive.Students look at a graph and determine the slope and the y-intercept.This is an interactive, digital mad lib for math. Students work through 15 slides. Each slide consists of a problem and four possible choices. Students select their answers and then type them into the appropriate spaces on the last slide. The answers will cr
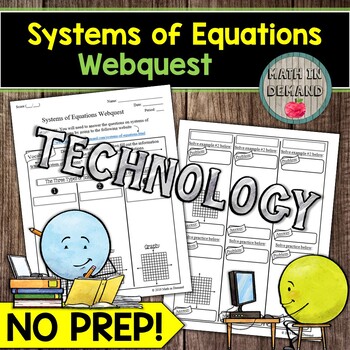
Systems of Equations Webquest Math
Students will need a device for my math webquest on systems of equations. Students will be given a link that goes to my website containing information about the number of solutions (no solution, one solution, and infinitely many solutions), and how to determine the number of solutions by using graphing, substitution, and elimination. I have included a worksheet that aligns to the information on my website. All you need to do is print and go! In addition, there is a 10 problem quiz on my website.

Hurricane Project
This is a great project for students to understand hurricanes to the full extent. We would study hurricanes over a few weeks showing students videos, data, going to the National Hurricane Center website, giving them the opportunity to learn how to plot coordinates and track them. They will understand the damage that can be done and who is called in after a hurricane has hit and the help the city will receive. They will create a hurricane from start to finish, choosing a name based on the month o
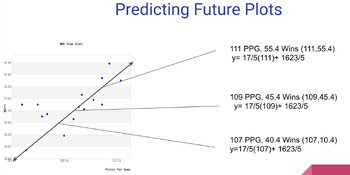
Scatter Plot Project on Desmos with Template
Learners will work to collect their own data from something they are interested in. They will then create a scatter plot using Desmos.com and analyze the information they collected. The analysis includes drawing their own trend line, finding the equation of that trend line, and predicting 3 values outside their original data collection. There are detailed directions with screenshots included along with a Google Slides template that can be shared with learners to help them organize their work. I
Subjects:
Grades:
7th - 9th
Types:

Classroom Stockmarket Challenge Project
This project is a real-life example of using percent of change and graphing. The beauty of this project is that it can be done with computers if available or just paper and pencil. It can be used to teach percent of change, graphing, interpretation of data, finance and business. The project can be used as a blank day (at end of unit) or end of year project. I have used it with 7th grade Advanced Math and 8th graders in Pre-Algebra.Other Projects you may be interested in:Circle Graphs using a Spo
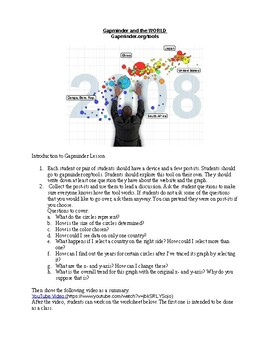
Gapminder and the World Activity
Students use gapminder.org/tools to discover the relationships between various historical factors and the population of many countries over time. This lesson connects history with linear relationships. It is a great way to add context to graphs and help students apply their math knowledge in a unique cross-content way.
Subjects:
Grades:
8th - 12th
Types:
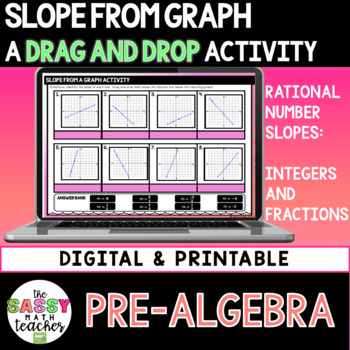
Finding Slope From A Graph
Finding Slope From Graph Digital ActivityStudents will practice finding slope from a total of 8 graphs! Consists of 6 lines with provided points and 2 graphs without. Topics Included:Positive and Negative SlopesRational Number SlopesThis product includes the following:Student DirectionsTeacher directionsPrintable Version of the Slope from a Graph worksheet Digital Version of the Slope from Graph Worksheet ⭐️ Includes a PowerPoint file and link to make a copy in Google SlidesDeta
Grades:
8th - 9th
Types:
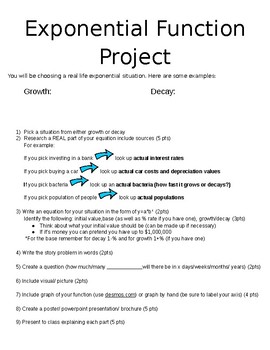
Exponential Function Real Life Project
Students pick an exponential growth or decay situation and research real life rates or values. Furthermore, they create an equation, write a story problem, ask and answer a question, create a graph and present a powerpoint or poster about their exponential situation.
* Note blank space under growth and decay is meant for a whole class brainstorm about the different scenarios they can think of.
Subjects:
Grades:
8th - 12th
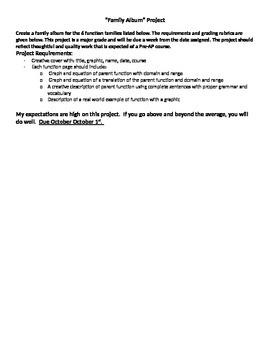
Family Album Project
A project designed to summarize the transformations, characteristics, and domain and range of the parent functions. Allows students to be creative.
Subjects:
Grades:
9th - 12th
Types:

Introduction to Sharks, Skates and Rays
Biology, Marine Biology, Upper Level Elementary ScienceIncluded in the package:- Introduction to Sharks Powerpoint (41 slides)- Shark Anatomy Powerpoint (46 slides)- Cartilaginous Fish (Rays & Skates) (44 slides)- Shark Game Show (Jeopardy style) Review PowerpointTo assess:- Shark Test- Shark Test Study Guide- Shark Test Study Guide ANSWERS- Cartilaginous Fish Quiz - Cartilaginous Fish Quiz ANSWERSStudents Research and Activities:- Shark Species Internet Research Questions- Shark Species Pre
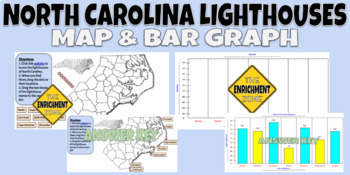
North Carolina Lighthouses Map and Bar Graph
North Carolina's lighthouses are some of the most famous in the world. There are 7 standing lighthouses along the coast of NC and many students may never see them in person. In this resource, students will be able to research where those lighthouses are and how tall they are. What's included:1. Blank map of NC coast and directions for students to go to a website and locate the lighthouses, then come back to the Google Slides and drag the circles/names to the correct location.2. Blank bar graph
Grades:
3rd - 12th
Types:

6 Editable Bar Graph Templates 2.0
Finally a simple and professional graph space that students can fill out without any design issues getting in the way. This file contains 6 ready-to-use graph options. Print them and have students fill them with pencil and ruler, or distribute them over computer and let them practice entering the data. Get a project perfect finish every time. Maybe you just want to fill it out live on a projector? The possibilities are endless! It's okay to say you love these bar graphs. So do we.Contains:- 2 bl
Showing 1-24 of 51 results


