48 results
High school graphing teacher manuals for Microsoft OneDrive

Exponential Functions Introduction Activity in Digital and Printable
Engage students with this intro lesson that will get them thinking exponentially.Included in download:Would you rather? Choices to get students thinking (PDF and Google Forms Poll included)Table and Graph for students to explore linear vs. exponential results of the given choices (printable PDF, Google Sheets, and Microsoft Excel versions included)Answer KeyExponential functions are a difficult concept for students because they are used to thinking about linear relations. Before telling students
Grades:
8th - 9th
Types:
CCSS:
Also included in: Algebra 1 Discovery Lessons and Inquiry Activities Bundle

Rates & Proportional Relationships Real World Project
Students work with real world rate of change and proportional relations as entrepreneurs creating a business startup! They will love getting creative, and you will love that everything is ready to go to get them thinking about math. This project is included in printable PDF version, Google Slides, and PowerPoint.In this project, students get creative as they decide on a type of business, membership fees, and a building location. Then they must calculate their costs and profits based on those dec
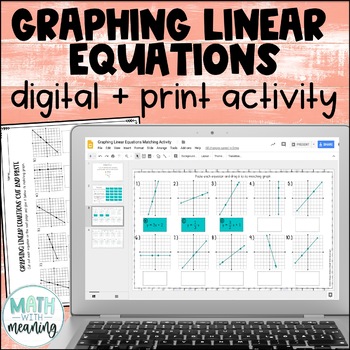
Graphing Linear Equations Digital and Print Activity for Google Drive
Looking for an engaging, no-prep activity to practice matching linear equations to their graphs? Students will match 20 equations to their graphs with this fun digital and print activity. Many of the equations are very similar and involve the same numbers, so students will need to work carefully!All equations are written in slope-intercept form. The graphs include positive, negative, zero, and undefined slopes. Please view the preview file to make sure that this activity is appropriate for your
Grades:
6th - 9th
CCSS:
Also included in: Middle School Math Digital and Print Activity Bundle Volume 2
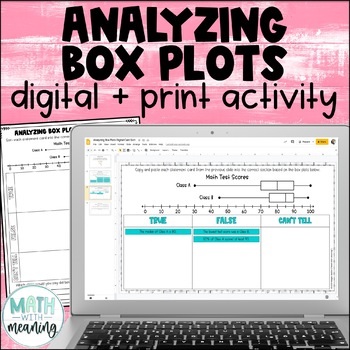
Box and Whisker Plot Digital and Print Card Sort - Reading and Analyzing
Looking for an engaging, no-prep activity to practice reading and analyzing box plots? Students will look at a double box plot and determine if statements about it are true, false, or if they can't tell from the information given in this fun digital and print activity.This activity includes statements about the minimum, maximum, median, quartile 1 (Q1), quartile 3 (Q3), interquartile range (IQR), and range of the box plots, along with statements about the percentages represented by a particular
Subjects:
Grades:
6th - 9th
Also included in: Middle School Math Digital and Print Activity Bundle Volume 3

Digital Linear Relationships Halloween Escape Room Activity
Students will love this engaging practice activity for linear relationships. They must try to escape a haunted house! Includes Google Slides and PowerPoint versions. They are given 14 problems to solve, choosing from 3 possible answers for each one. If they solve correctly, they will choose the correct door and avoid the scary giant spiders! If they make a mistake, a spider appears, and they are prompted to try again. Problems include linear graphs, table of values, equations, and stories. Thi
Grades:
7th - 9th
Types:
CCSS:

Slope Digital Math Escape Room Activity for Halloween
Students will love this fun practice activity for calculating slope between 2 points. Answering correctly will help them escape a haunted house! Includes Google Slides and PowerPoint versions. They are given 14 problems to solve, choosing from 3 possible answers for each one. If they solve correctly, they will choose the correct door and avoid the scary giant spiders! If they make a mistake, a spider appears, and they are prompted to try again. For each problem, students are given two ordere
Grades:
7th - 9th
Types:
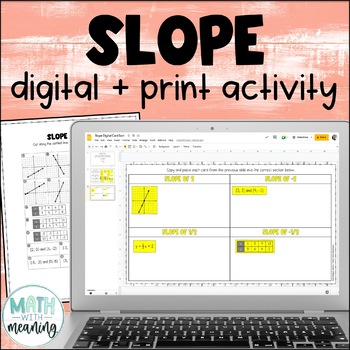
Finding Slope from Graphs, Tables, Equations, and Points Digital Card Sort
Looking for an engaging, no-prep activity to practice finding the slope when given a graph, equation, table, or two points? Students will sort 22 cards based on their slope in this fun digital and print card sort activity.Each problem gives either a table, a graph, two points, or an equation in slope-intercept form and asks students to find the slope. Please view the preview file to make sure that this resource is appropriate for your students.This product includes the following:A link to the ac
Grades:
6th - 9th
Also included in: Middle School Math Digital and Print Activity Bundle Volume 3

Distance Between 2 Points Practice PowerPoint & Google Slides
Students use the Pythagorean Theorem to find distances between points on a coordinate grid in this no-prep, self-checking activity. Four types of problems are included:Distance between 2 points on a graphDistance between 2 points sketched (for large numbers)Perimeter of polygons on a graphReal world map application problemsSolutions are in the format of whole numbers, decimals, roots, and rounded approximations. Problems range from very basic to challenging!16 problems are included. Each one is
Grades:
8th - 10th
Types:
Also included in: 8th Grade Geometry Unit Activities and Lessons

Money from Mars: Teaching Systems of Equations with Understanding
This is an engaging and proven approach to teaching systems of equations. It has even been used with students in 4th & 5th grades successfully and is a great approach for students in pre-algebra classes, struggling algebra students, and even those in a traditional algebra program.The multi-representational approach begins by integrating visual models with a guess-and-check strategy tied to t-tables and graphs fostering rich connections in conceptual understanding.This then leads seamlessly i
Grades:
6th - 9th
Digital Mad Lib Math Activity - Identify Slope and Y-Intercept from a Graph
No prep. No paper. No materials. Totally digital. Great for Distance Education, 1:1, BYOD, or math computer centers. Google Drive, Google Classroom, and Microsoft One Drive.Students look at a graph and determine the slope and the y-intercept.This is an interactive, digital mad lib for math. Students work through 15 slides. Each slide consists of a problem and four possible choices. Students select their answers and then type them into the appropriate spaces on the last slide. The answers will cr
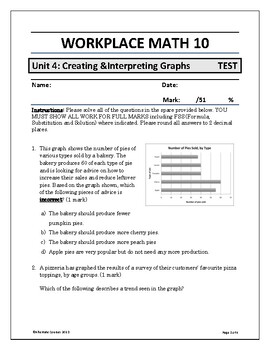
Workplace Math 10 Unit 4: Creating and Interpreting Graphs TEST
©Alternate Courses creates simplified curriculum including outlines, progress charts, notes, worksheets, tests, and inquiry projects that can be used in a traditional inclusive classroom as well as for asynchronous and remote learning. Our course work meets all the learning outcomes of the new British Columbia curriculum in a simplified form for independent, self-paced work without the need for a textbook. We at ©Alternate Courses create the curriculum so that you can spend more time creating co
Subjects:
Grades:
10th
Also included in: Workplace Math 10 Unit 4: Creating and Interpreting Graphs BUNDLE
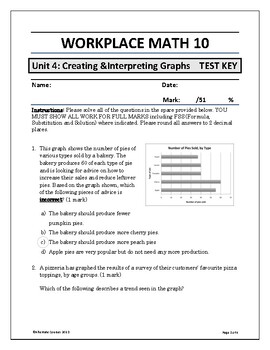
Workplace Math 10 Unit 4: Creating and Interpreting Graphs TEST KEY
©Alternate Courses creates simplified curriculum including outlines, progress charts, notes, worksheets, tests, and inquiry projects that can be used in a traditional inclusive classroom as well as for asynchronous and remote learning. Our course work meets all the learning outcomes of the new British Columbia curriculum in a simplified form for independent, self-paced work without the need for a textbook. We at ©Alternate Courses create the curriculum so that you can spend more time creating co
Subjects:
Grades:
10th
Also included in: Workplace Math 10 Unit 4: Creating and Interpreting Graphs BUNDLE
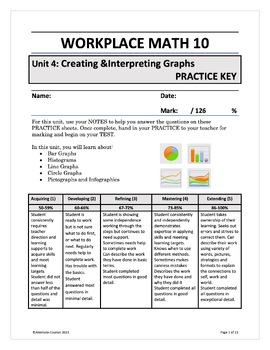
Workplace Math 10 Unit 4: Creating and Interpreting Graphs PRACTICE KEY
©Alternate Courses creates simplified curriculum including outlines, progress charts, notes, worksheets, tests, and inquiry projects that can be used in a traditional inclusive classroom as well as for asynchronous and remote learning. Our course work meets all the learning outcomes of the new British Columbia curriculum in a simplified form for independent, self-paced work without the need for a textbook. We at ©Alternate Courses create the curriculum so that you can spend more time creating co
Subjects:
Grades:
10th
Also included in: Workplace Math 10 Unit 4: Creating and Interpreting Graphs BUNDLE
TI-84 Calculator Guides Bundle--all are fully editable
This bundle of 5 step-by-step guides to using the TI-84 (or 83) calculators will make teaching your students a breeze! They each have screenshots, keystroke guides and written instructions along with at least one example for students to work through. They serve as great reminder manuals for students after the lesson as well.****************************************************************************************************************You may also like:BUNDLE: Function Families and Transformati
Grades:
8th - 11th
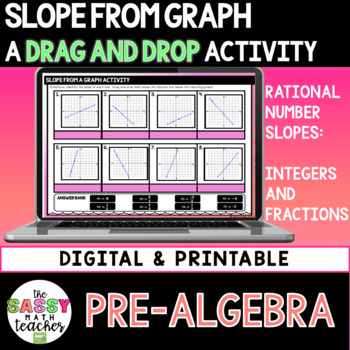
Finding Slope From A Graph
Finding Slope From Graph Digital ActivityStudents will practice finding slope from a total of 8 graphs! Consists of 6 lines with provided points and 2 graphs without. Topics Included:Positive and Negative SlopesRational Number SlopesThis product includes the following:Student DirectionsTeacher directionsPrintable Version of the Slope from a Graph worksheet Digital Version of the Slope from Graph Worksheet ⭐️ Includes a PowerPoint file and link to make a copy in Google SlidesDeta
Grades:
8th - 9th
Types:

TI-Nspire Graphing Calculator for Geometry (First Edition)
A graphing calculator can be used to bridge the gap between traditional teaching and 21st century technology. Explore, prove, create, and animate geometric proofs, logic statements, two-dimensional and three-dimensional figures. Your Imaginations is your only limitation.Contents:Simplifying Radicals Unit Conversion (Length)Unit Conversion (Volume)Conditional Statement - Light Bulb (Intermediate) Angle BisectorPerpendicular LinePerpendicular Bisector Equilateral TriangleConstant Rate of Change (S
Subjects:
Grades:
8th - 12th
Also included in: Geometry Bundle
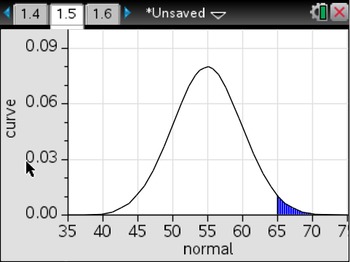
Normal Curve PDF: TI-NSpire Calculator Steps
This NSpire Calculator unit is designed for math department chairs, specialists, coaches, administrators, lead teachers, and classroom teachers. It contains ESSENTIAL information you need to cover Virginia SOL A.9 and AII.11 (Z-Scores, Standard Deviation, Normal Curve, Empirical Rule) properly.
Please enjoy. If you have any questions or comments, please do not hesitate to contact me at rturner31@gmail.com. I appreciate your feedback! Thanks for your purchase.
Subjects:
Grades:
7th - 12th
Types:
Scatter Plots/Line of Best Fit/Linear Regression TI-84 or 83--Editable
A step-by-step guide with screenshots and written instructions for how to set up the TI-84 (or 83) calculator to graph scatter plots and figure the line of best fit using Linear Regression.Uploaded in Word and PDF versions for ease of printing/editing.****************************************************************************************************************You may also like:How to graph linear systems with TI-84How to graph basic equations with TI-84Finding Vertices of Systems of Inequaliti
Grades:
8th - 11th
Types:
Also included in: TI-84 Calculator Guides Bundle--all are fully editable
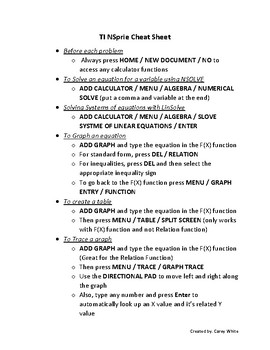
TI Nspire Calculator Cheat Sheet
This a cheat sheet is designed to help the users of the TI Nspire calculators. It gives detailed instructions on how to use certain functions on the calculator step by step. It was created to help my Algebra I students use the new calculator.
Subjects:
Grades:
7th - 12th, Higher Education, Adult Education, Staff
CCSS:
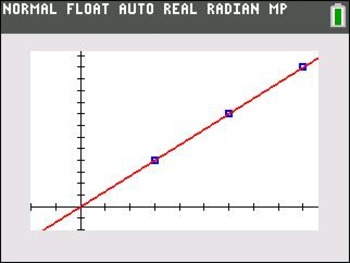
Direct Variation (Interactive) Complete Unit in Smart Notebook; VA SOL A.8
This unit is designed for math department chairs, specialists, coaches, administrators, lead teachers, and classroom teachers. It contains EVERYTHING you need to cover Virginia SOL A.8 (Direct Variation) properly.
Please enjoy. If you have any questions or comments, please do not hesitate to contact me at rturner31@gmail.com. I appreciate your feedback! Thanks for your purchase.
Subjects:
Grades:
7th - 12th
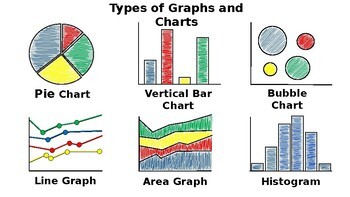
Types of Graphs and Charts - Science Journal Illustration
This is a step by step illustration of each of the 12 types graphs and charts that can be created using Microsoft Excel/Google Sheets. This can be used as an introduction to any Microsoft Excel/Google Sheets Graph and Charts lesson plan. Students use 2 pieces of blank paper and colored pencils to build background knowledge of the types of graphs and charts able to be utilized by entering data on an Excel/Google Spreadsheet and transforming the data into visual representations.

How To Graph/Solve Linear Systems with TI-84 Calculator--Editable
This is a step-by-step guide to using the TI-84 calculator to graph and solve systems of linear equations and find the point of intersection. There are screenshots and keystroke images along with the written instructions. Easy to leave as sub plans to let students teach themselves to use the calculator.These instructions will also work for the TI-83.It is in Word and PDF format for ease of printing or editing.*************************************************************************************
Grades:
8th - 11th
Types:
Also included in: TI-84 Calculator Guides Bundle--all are fully editable
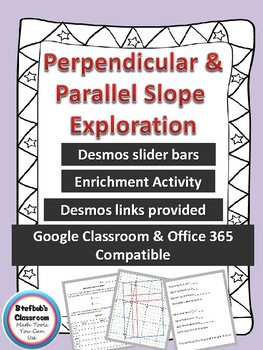
Parallel and Perpendicular Slope Exploration
Perpendicular and Parallel Slope Exploration gives students a chance to discover the relationship of slopes of parallel and perpendicular lines. They will use Desmos slider bar tools to do so. (Click here to see an example of how slider bars work.) Students will record their discovered parallel and perpendicular equations in tables. The tables are followed by leading questions about slope relationships and check for understanding problems. To conclude the activity, teachers can provide students
Grades:
9th - 10th
Types:
CCSS:
Direct Variation Unit in PDF - 36 Slides; VA SOL A.8
This unit is designed for math department chairs, specialists, coaches, administrators, lead teachers, and classroom teachers. It contains EVERYTHING you need to cover Virginia SOL A.8 (Direct Variation) properly.
Please enjoy. If you have any questions or comments, please do not hesitate to contact me at rturner31@gmail.com. I appreciate your feedback! Thanks for your purchase.
Subjects:
Grades:
7th - 12th
Showing 1-24 of 48 results


