77 results
Statistics internet activities $5-10
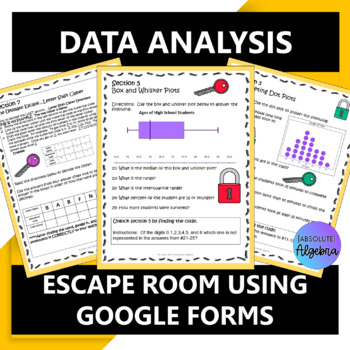
Data Analysis Digital Digital Escape Room using Google Forms
#overtherainbow Data Analysis Digital Escape Room Google FormsGive your students comprehensive practice on data analysis including variability, mean, median, mode, range, IQR, box and whisker, dot, stem and leaf plots, histograms, relative frequency tables, and more! This is a NO PREP Escape Room using technology! Just hand your students the worksheet, give them URL for the google form and they're ready to go!This resource includes:VariabilityMean, Median, Mode, Range, and Interquartile Range (I
Subjects:
Grades:
6th - 7th
Types:
Also included in: Middle School Math Activities Bundle
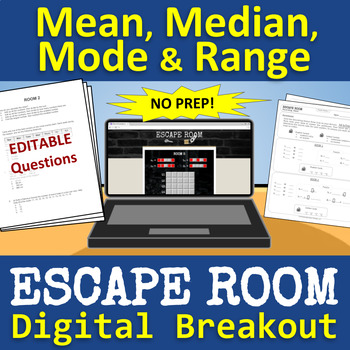
Mean, Median, Mode & Range ESCAPE ROOM - Digital Breakout | Distance Learning
Students will have a blast trying to break out of this escape room! There are 5 digital rooms with fun puzzles that engage students and challenge their problem-solving skills while they practice math content (mean, median, mode and range). Great for team-building! Quick and easy setup. Includes 100% digital option! CLASSROOM SETUP:Print/copy the math questions for each group.Print/copy the recording sheet for each student.Provide a device for each group (the Escape Room link is on the recording
Subjects:
Grades:
6th - 8th
Also included in: Math Escape Room - Digital Breakout - BUNDLE
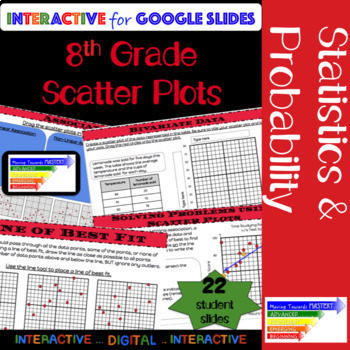
8th Grade Math Scatter Plot: Guided Interactive Lesson
Extensive ALL digital guided lesson for constructing and interpreting scatter plots.The slides are scaffolded to build understanding. Students will progress from identification of terms to making predictions involving bivariate data. The guided slides will begin with identification, move towards assisted analysis, and conclude with independent practice.Slides include...♦ Definitions and Visual Representations♦ Identification and Use of Terms→ Bivariate Data→ Scatter Plot→ Linear, Nonlinear, &
Subjects:
Grades:
8th - 10th
Types:
CCSS:
Also included in: 8th Grade Math Common Core Growing Bundle
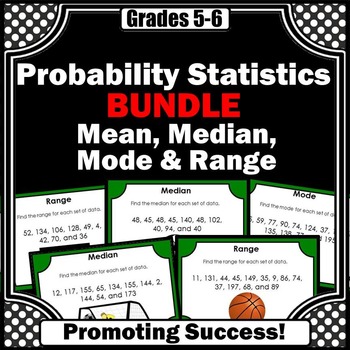
Mean Median Mode Range Task Cards BUNDLE Measures of Central Tendency Games
DIGITAL PDF AND PRINTABLE PACKET: In this bundle, you will download 120 (4 sets) mean, median, mode and range task cards for your 6th grade, 7th grade, and special education math students to practice measures of central tendency. You may use the printable task cards in math centers or stations for fun practice and review games and activities, such as a scavenger hunt or SCOOT. They also work well for transition activities, as exit tickets, for morning work, and as quick formative assessments. G
Subjects:
Grades:
5th - 7th
CCSS:
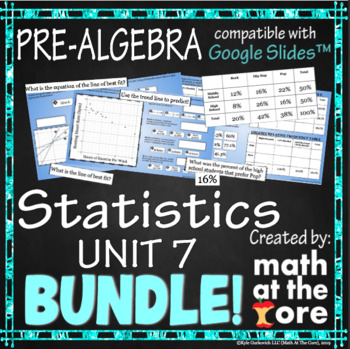
Statistics - Unit 7 - BUNDLE for Google Slides™
- Great for online and distance learning! Created to be compatible with Google Slides™!-In this interactive unit, students will interpret scatter plots. They should be able to determine what type of correlation a situation has whether it is by graph or through words. They should be able to identify clusters and outliers. students will analyze scatter plots and determine the line of best fit. They will use the line of best fit and the equation of that line to predict values. They should also be a
Subjects:
Grades:
7th - 8th
Types:
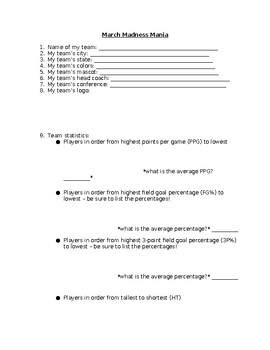
NCAA March Madness Basketball Tournament Team Research Statistics
Do you have students interested in the March Madness basketball tournament? Then this is the activity you need!To begin our March Madness unit, we look at all of the teams participating in the tournament and complete a map together to show where each team is from. We notice that some states have more than others and some states have none, and spend time discussing why that might be. Students will complete their own March Madness bracket.Students will then select a team in the NCAA March Madness
Grades:
4th - 9th
Types:
Interpreting Visual Displays of Data Bundle *Google Classroom* Distance Learning
This bundle will provide your students with practice interpreting data and finding central tendency. Includes activity for:Central TendencyInterpreting Dot PlotsInterpreting HistogramsInterpreting Frequency TablesInterpreting Box and Whisker Plots2 Ways to Assign Each Activity - I've included these resources as both a google form and google slides. When using the google form, students will type the answers into a google form quiz and it will grade it for you! When using the google slides, studen
Subjects:
Grades:
5th - 9th
Types:

Statistics Unit Review Scavenger Hunt
This engaging, digital, no-prep activity has 18 practice problems where students will solve for a mixture of Statistics questions taught for the 7th grade Inferences Unit and Standards. The scavenger hunt activity problems can be printed for a fun activity around the room/hallway/outside or the activity can be done digitally while recording answers on the provided printable recording sheet or the provided digital Google form recording sheet. The mixed review covers standards S1-S4. Students can
Subjects:
Grades:
6th - 7th
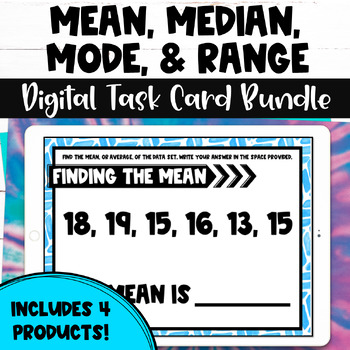
Mean Median Mode and Range Digital Task Card Measures of Spread Bundle
A bundle of four no print, no-prep resources to give your students practice finding the mean, median, mode, and range of various data sets. To use each digital set of task cards, students will type into the text boxes to enter their answers. This independent practice activity builds computer and math skills at the same time and is perfect for distance learning or in-person learning.This bundle includes...Purchasing this bundle saves you 20% off the list price for the following products!Finding t
Subjects:
Grades:
5th - 7th
Types:
CCSS:
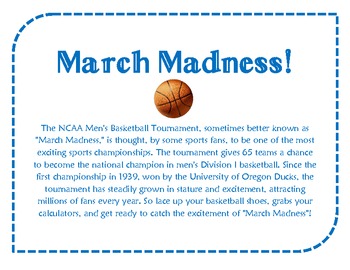
March Madness Mathematics
This project is designed for middle school students to show them how math can be used in real-life. This project uses the NCAA tournament to review data analysis and probability skills, such as bar graphs, experimental probability, and measures of central tendency.
-Before starting this project, the current year's bracket must be out. This can be found on the NCAA website or by doing a simple search for "NCAA bracket." Students will need the bracket to choose their 4 teams and also for the bon
Subjects:
Grades:
5th - 8th
Types:
Statistics & Data ★ Math TEK 8.11A 8.11B 8.11C ★ Digital 8th Grade Math Review
Are you looking for a unit's worth of engaging printable & digital activities that cover the whole 8.11 TEKS Math Domain (Statistics and Data) while being immediately implementable in printable and digital formats? If that sounds like something you might be interested in, I'm confident this product is going to meet and exceed your expectations!If accessed digitally, these task card sets can be pre-loaded as no-prep assessments/assignments through Google Forms™, Google Slides™, or as a Boom
Subjects:
Grades:
8th - 9th
Types:
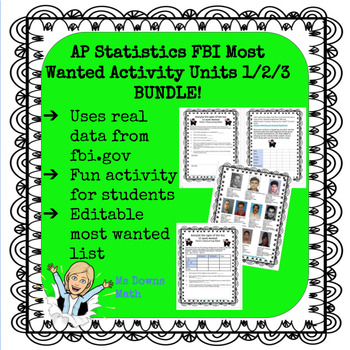
FBI Most Wanted AP Stat - Analyze Data, Normal Distributions, Linear Regression
I have created a series of activities for several units in the AP Statistics curriculum. The students love using data from fbi.gov to review concepts. This activity involves analyzing data related to the top 10 most wanted fugitives. I created this activity in May of 2020 and used the top 10 at that time. In the folder, you will find an editable slide of the top 10 if you want to change it.The answer key for the unit is based on the original top 10 that I used. Teachers have the option of having
Subjects:
Grades:
10th - 12th
Types:
CCSS:
Analyzing Data ★ Math TEKS 7.12A, 7.12B & 7.12C ★ 7th Grade STAAR Math Review
Are you looking for a unit's worth of engaging printable & digital activities that cover the 7.12 TEKS Math Domain (Analyzing Data) while being immediately implementable in printable and digital formats? If that sounds like something you might be interested in, I'm confident this product is going to meet and exceed your expectations!If accessed digitally, these task card sets can be pre-loaded as no-prep assessments/assignments through Google Forms™, Google Slides™, or as a Boom Cards™ or Se
Subjects:
Grades:
7th - 8th
Types:
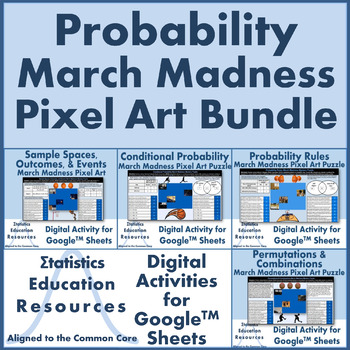
Bundle: Probability March Madness Pixel Art Puzzles (Common Core Aligned)
This bundle includes 4 self-checking March Madness pixel art probability puzzles created in Google™ Sheets. Students practice solving problems on sample spaces, conditional probability, probability rules, permutations, and combinations while solving March Madness puzzles. Students use both computation and contextual interpretation to solve problems. This fun twist on worksheets engages students by allowing them to independently solve March Madness pixel art puzzles as they reinforce probability
Subjects:
Grades:
9th - 12th
Types:
CCSS:
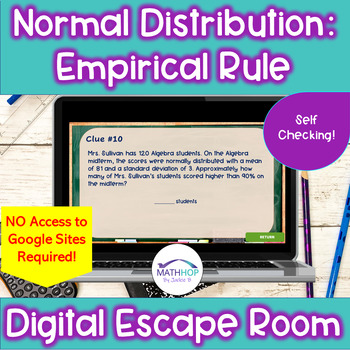
Normal Distribution: Applying the Empirical Rule: Digital Escape Room
Do you need an ENGAGING, & Self Checking activity on solving word problems using the Empirical Rule? All clues contain a word problem that asks the students to interpret a normal distribution and use the empirical rule to solve investigative questions. This is an essential skill for Statistics that students struggle with. 100% Digital & Self Checking – this escape room is ready to go and is NOT housed on a Google Site. Just share the Genially link with students you can also share the lin
Subjects:
Grades:
10th - 12th
Types:
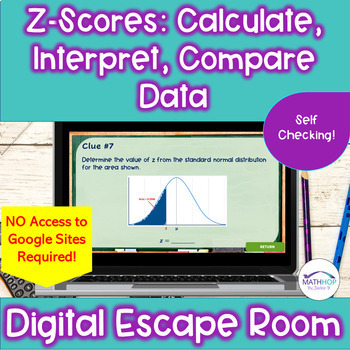
Z-Scores: Calculate, Interpret & Compare Data: Digital Escape Room
Do you need an ENGAGING, & Self Checking activity on: solving word problems involving determining, interpreting, and using z-scores to solve problems and compare data? All clues contain a word problem that asks the students to solve a problem involving data and z-scores. A z-scores table is included to give to students. Using z-scores is an essential skill for Statistics that students struggle with. 100% Digital & Self Checking – this escape room is ready to go and is NOT housed on a Goo
Subjects:
Grades:
10th - 12th
Types:
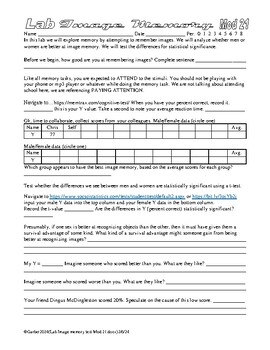
Psychology Lab Image Memory and Sex Differences AP Psychology Statistics
In this set of 13 labs the students do a variety of image memory tasks. They then collaborate and share data, then perform a T test on the data to find out if the differences between the scores of men and women are statistically significant. The students also test for correlations between a variety of scores. I suppose it is a sort of an expansion on my face memory lab. Links sometimes die, so try before you buy… https://www.psychologytoday.com/us/tests/iq/memory-test https://memtrax.com/cogniti
Subjects:
Grades:
9th - 12th, Higher Education, Adult Education
Types:
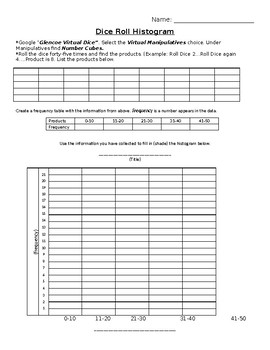
Dice Roll Histogram - Online Interactive Activity Frequency Table & Historgram
Students will complete a frequency table and histogram that corresponds to data collected through the use of rolling two dice (Statistics Lesson). To get the data for this frequency table, students will roll two dice and multiple the numbers rolled together. The product of these two rolls will be the data point. Students will write down each product, rolling their dice a total of 45 times. Students will then fill in the frequency table and graph on a histogram. We used an online dice. This helps
Subjects:
Grades:
5th - 8th
Types:
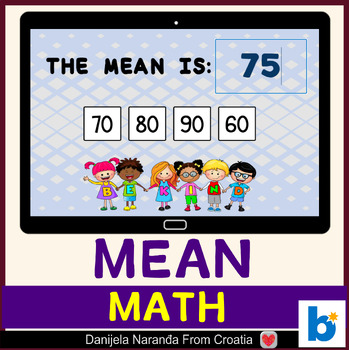
Mean MATH Boom ™ Cards
Students will find the mean of a data set.Cards and numbers are randomized.To use Boom Cards, you must be connected to the Internet. Boom Cards play on modern browsers (Chrome, Safari, Firefox, and Edge). Apps are available for modern Android, iPads, iPhones, and Kindle Fires. For security and privacy, adults must have a Boom Learning account to use and assign Boom Cards. You will be able to assign the Boom Cards you are buying with "Fast Pins," (a form of play that gives instant feedback to stu
Subjects:
Grades:
4th - 7th
Types:
Also included in: Finding range mode median and mean MATH Boom ™ Cards
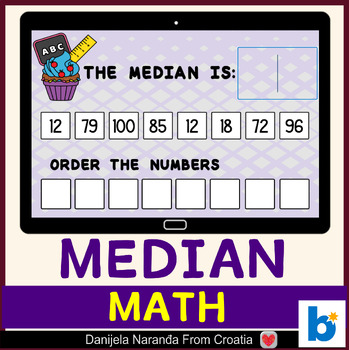
Median MATH Boom ™ Cards
Students will find the median of a data set.To use Boom Cards, you must be connected to the Internet. Boom Cards play on modern browsers (Chrome, Safari, Firefox, and Edge). Apps are available for modern Android, iPads, iPhones, and Kindle Fires. For security and privacy, adults must have a Boom Learning account to use and assign Boom Cards. You will be able to assign the Boom Cards you are buying with "Fast Pins," (a form of play that gives instant feedback to students for self-grading Boom Car
Subjects:
Grades:
4th - 7th
Types:
Also included in: Finding range mode median and mean MATH Boom ™ Cards
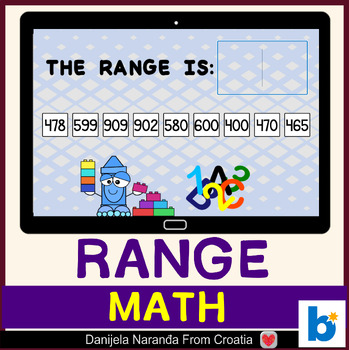
Range MATH Boom ™ Cards
Students will find the range of a data set.Cards and numbers are randomized.To use Boom Cards, you must be connected to the Internet. Boom Cards play on modern browsers (Chrome, Safari, Firefox, and Edge). Apps are available for modern Android, iPads, iPhones, and Kindle Fires. For security and privacy, adults must have a Boom Learning account to use and assign Boom Cards. You will be able to assign the Boom Cards you are buying with "Fast Pins," (a form of play that gives instant feedback to st
Subjects:
Grades:
4th - 7th
Types:
Also included in: Finding range mode median and mean MATH Boom ™ Cards
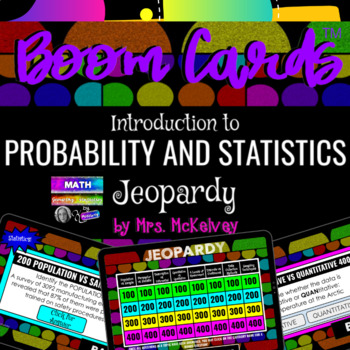
Intro to Statistics Jeopardy Review Game using DIGITAL SELF CHECKING BOOM CARDS™
Probability and Statistics students will enjoy reviewing population vs. sample, parameter vs. statistic, descriptive vs. inferential, quantitative vs. qualitative, the four levels of measurement, discrete vs. continuous, data collection methods, and sampling techniques with these fun and interactive digital Boom task cards! This deck is in the form of a Jeopardy style game, using Flow Magic to help students navigate from the game board, to feedback, and back to the game board for the next round!
Subjects:
Grades:
11th - 12th, Higher Education
Types:
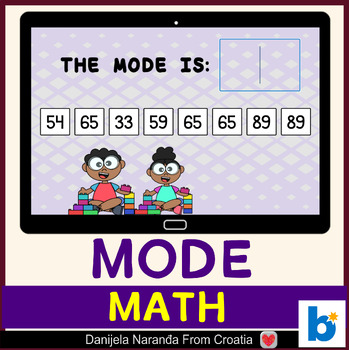
Mode MATH Boom ™ Cards
Students will find the mode of a data set.Cards and numbers are randomized.To use Boom Cards, you must be connected to the Internet. Boom Cards play on modern browsers (Chrome, Safari, Firefox, and Edge). Apps are available for modern Android, iPads, iPhones, and Kindle Fires. For security and privacy, adults must have a Boom Learning account to use and assign Boom Cards. You will be able to assign the Boom Cards you are buying with "Fast Pins," (a form of play that gives instant feedback to stu
Subjects:
Grades:
4th - 7th
Types:
Also included in: Finding range mode median and mean MATH Boom ™ Cards
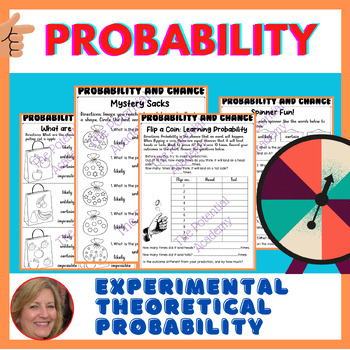
(BUNDLE) Chance and Probability worksheets & Area and Perimeter 3rd math
**Chance and Probability, Theoretical & Experimental Probability Activities**Do your children have trouble determining the likelihood of events and situations? Then this Probability and Chance package is for you! This set is packed with full worksheets and activities to teach your children all about Probability & Chance.There is a set of questions about Probability and Chance for a student to get to know the concept of Probability through the language of change: likely, unlikely, certain
Subjects:
Grades:
4th - 7th
Types:
Showing 1-24 of 77 results


