2,290 results
High school graphing internet activities for Microsoft Word

Beaker Pong: Experimental Design and Graphing Lab, NGSS aligned
Great 1st week or 1st month STEM activity! All parts are EDITABLE and includes a graphing grid! This is a great way to introduce the "science process" (better phrase for scientific method) at the start of a semester or anytime you want fun to occur in your classroom.*****Focus on the NGSS PRACTICES Dimension*****The National Research Council's (NRC) Framework describes a vision of what it means to be proficient in science; it rests on a view of science as both a body of knowledge and an evidenc
Subjects:
Grades:
7th - 12th
Types:
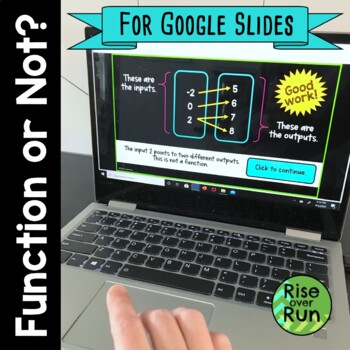
Identifying Functions Practice Activity for Google Slides
Students can practice identifying functions with this self-checking practice activity in Google Slides. This resources includes tables of values, lists of ordered pairs, graphs, and mapping diagrams. Students determine if each relation is a function or not. They can also click to see helpful tips. The resource will let students know if they are correct or not (along with an explanation) after each example. 15 relations are included. After the practice, a final slide asks students to explain ho
Subjects:
Grades:
8th - 9th
Types:
CCSS:
Also included in: Identifying Functions Unit with Activities, Notes, Practice, and Test
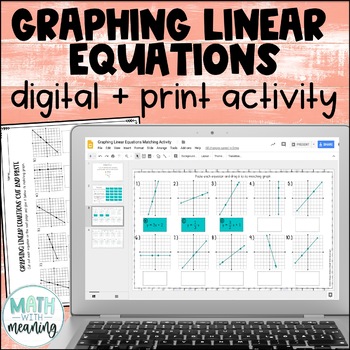
Graphing Linear Equations Digital and Print Activity for Google Drive
Looking for an engaging, no-prep activity to practice matching linear equations to their graphs? Students will match 20 equations to their graphs with this fun digital and print activity. Many of the equations are very similar and involve the same numbers, so students will need to work carefully!All equations are written in slope-intercept form. The graphs include positive, negative, zero, and undefined slopes. Please view the preview file to make sure that this activity is appropriate for your
Grades:
6th - 9th
CCSS:
Also included in: Middle School Math Digital and Print Activity Bundle Volume 2
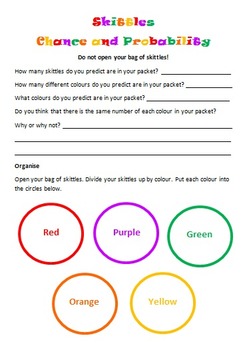
Skittles Chance and Probability (Editable)
Chance and Probability activity using yummy Skittles!!!
Students are to predict the colours and quantities before they open the skittles bag. Students are to complete a chance experiment where they use a tally to collect their data. Students then transfer their data in fractions, decimals and percentages. Students are to create a bar graph using their data as well as answer chance and probability questions about the data. I used this with my grade 5/6 students and they loved it!
Subjects:
Grades:
3rd - 10th
Types:
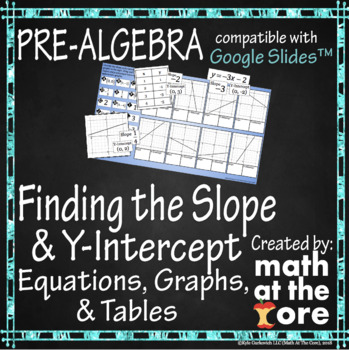
Finding Slope and Y-Intercept - Equations, Graphs, & Tables for Google Slides™
- Great for online and distance learning! Created to be compatible with Google Slides™!- In this digital activity, students will identify the slope and y-intercept of equations (in slope-intercept form), graphs, and tables.- This activity includes 25 different equations, graphs, and tables over three slides. They will drag and drop the slope and y-intercept to match with its correct equation, graph, or table.Available in the full curriculum bundles below!Pre-Algebra - Curriculum - BUNDLE for Goo
Subjects:
Grades:
7th - 9th
Types:
Also included in: Linear Functions - Unit 4 - BUNDLE for Google Slides™
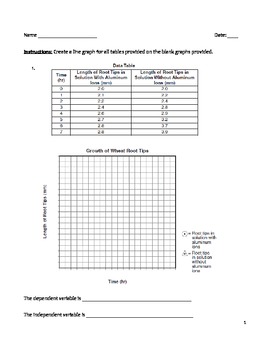
High School Science Graphing Worksheet - Making Line Graphs in Science
Use this worksheet to help your students practice making line graphs. In addition, they will have to identify both the independent and dependent variables. Hopefully, they will make the connection between the variables and their placement on the graph. There is a key provided for the teacher. There are ten line graphs for students to work with.
line graph, plot points, independent variable, dependent variable, data table, uniform scale, x-axis, y-axis
Subjects:
Grades:
8th - 12th
Types:
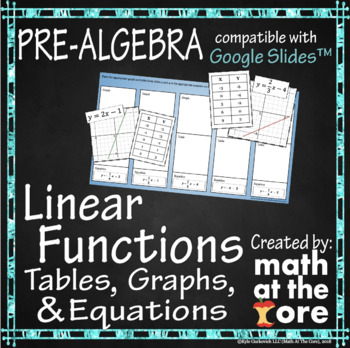
Linear Functions - Tables, Graphs, & Equations for Google Slides™
- Great for online and distance learning! Created to be compatible with Google Slides™!- In this digital activity, students will match tables and graphs to their appropriate equation in slope-intercept form.- Students will need to know how to identify a linear equation from a graph and table. Includes 15 different linear functions to match (15 graphs, 15 tables, & 15 equations).Available in the full curriculum bundles below!Pre-Algebra - Curriculum - BUNDLE for Google Slides™Algebra 1 - Curr
Subjects:
Grades:
7th - 10th
Types:
CCSS:
Also included in: Linear Functions BUNDLE - Tables, Graphs, & Equations for Google Slides™
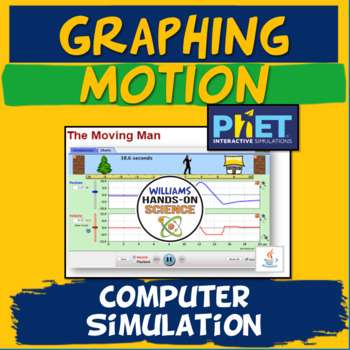
Graphing Motion MS-PS2-2: PhET Simulation: Moving Man Activity
Moving Man is a great way for your students to understand graphing motion and have fun while doing it! I’ve done this lab for years and my students are always engaged and have a much greater grasp of how motion looks on a graph. PhET simulations are my go-to when it comes to online simulations. You will need a computer and the correct software (system requirements: https://phet.colorado.edu/en/help-center/running-sims).You get the key and 4 pages of simulations and questions that involve the stu
Subjects:
Grades:
6th - 12th
Types:
NGSS:
MS-PS2-2
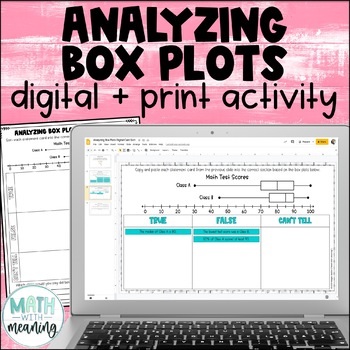
Box and Whisker Plot Digital and Print Card Sort - Reading and Analyzing
Looking for an engaging, no-prep activity to practice reading and analyzing box plots? Students will look at a double box plot and determine if statements about it are true, false, or if they can't tell from the information given in this fun digital and print activity.This activity includes statements about the minimum, maximum, median, quartile 1 (Q1), quartile 3 (Q3), interquartile range (IQR), and range of the box plots, along with statements about the percentages represented by a particular
Subjects:
Grades:
6th - 9th
Also included in: Middle School Math Digital and Print Activity Bundle Volume 3
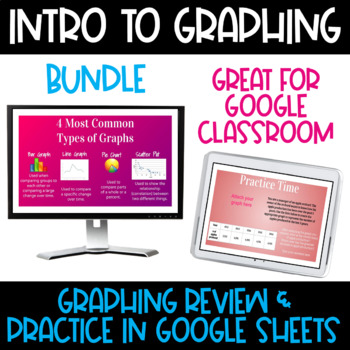
Google Classroom Interactive Slides: Intro to Graphing Bundle
Ain't Nobody Got Time to Graph! This Google Classroom resource is a great way to introduce graphing to your students in an easy step-by-step process! This product includes two of my graphing products bundled together for a 13% discount off the total price! In this interactive Google Classroom resource, students will learn about four types of graphs (bar graphs, line graphs, pie charts and scatter plots) as well as when to use each type of graph and how to create each type of graph using Google
Grades:
5th - 12th
Types:
Blank Bar Graph/Double Bar Graph Template
This is a bar graph template that can be used by teachers to teach students how to understand bar graphs and create their own bar graphs. Teachers can use this template teach students about parts of a bar graph and how to interpret data in bar graphs.
Grades:
1st - 12th
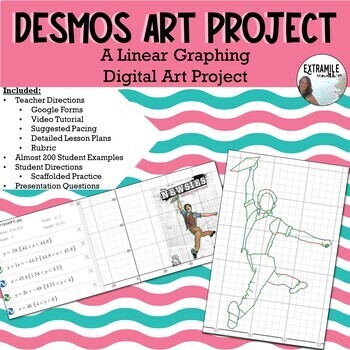
Desmos Art Project- Linear Graphing Project #backtoschool
See this project in action here: 10 Awesome Student Desmos Art Projects (Boomerangs)This project is an excellent way to get to know your students--even from afar!--while they engage in learning and practicing writing linear equations (vertical, horizontal, and slanted lines). The image they choose to "trace" using www.desmos.com is a great way to learn about their passions at the beginning of the year all while reviewing skills from previous years. This is a perfect project for the beginning of
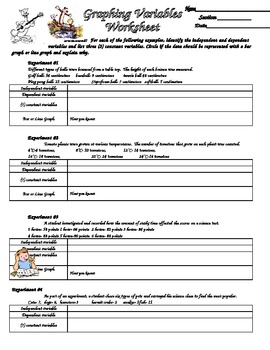
Scientific Method Variables and Graphing Practice
Students are given six different sets of experimental data and asked to identify the variables (independent, dependent etc.). They also reinforce graphing by identifying if the data should be represented with a bar or line graph. With this information, students the create data tables and graphs for the data.
Subjects:
Grades:
3rd - 12th
Types:
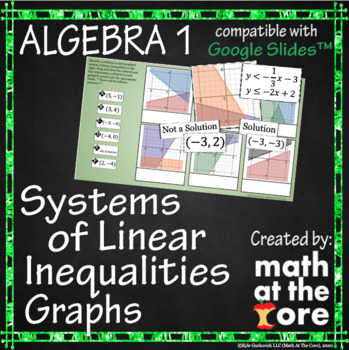
Systems of Linear Inequalities - Graphs for Google Slides™
- Great for online and distance learning! Created to be compatible with Google Slides™!- In this digital activity, students will be able to determine whether or not an ordered pair is a solution to a system of linear inequalities and identify systems of linear inequalities to graphs.- This activity includes 33 different problems involving systems of linear inequalities. There are 15 problems involving students determining whether or not an ordered pair is a solution to an inequality system. They
Subjects:
Grades:
8th - 9th
Types:
CCSS:
Also included in: Systems of Equations & Inequalities - Unit 8 - BUNDLE for Google Slides™
Linear Functions - Unit 4 - BUNDLE for Google Slides™
- Great for online and distance learning! Created to be compatible with Google Slides™!- In this interactive unit, students will be able to: identify all of the parts of the coordinate plane, understand proportional and non-proportional relationships, find the slope of a line through equations, tables, graphs, and two points, identify equations to linear functions through graphs, tables, and word problems, identify solutions to linear functions, compare linear functions through tables, graphs, a
Subjects:
Grades:
7th - 9th
Types:
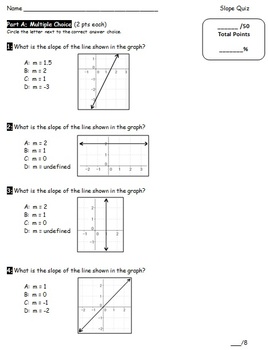
Editable Slope Quiz
This quiz covers finding slope from graphs, from tables, from sets of coordinate pairs and solving for y to make y=mx+b equations through a series of multiple choice and short answer questions. This quiz is editable and an answer key is is included.Related products:Slope Sorting ActivitySlope Puzzle Match
Subjects:
Grades:
8th - 9th
Types:
CCSS:
Also included in: SLOPE mini-bundle
Linear Functions BUNDLE - Tables, Graphs, & Equations for Google Slides™
This bundle includes all four Linear Function Matching Activities- Great for online and distance learning! Created to be compatible with Google Slides™!- These digital activities include students matching 15 to 18 linear function representations. The activities range from matching graphs to equations, tables to equations, graphs to tables, and all three combined! Linear function equations are represented in slope-intercept form.Available in the full curriculum bundle!Pre-Algebra - Curriculum - B
Subjects:
Grades:
7th - 10th
Types:
CCSS:
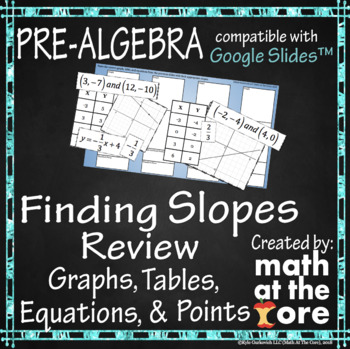
Finding Slopes Review - All Forms for Google Slides™
- Great for online and distance learning! Created to be compatible with Google Slides™!- In this digital activity, students will identify the slopes of graphs, equations, tables, and slopes that go through two ordered pairs. They will be given 16 different slopes and they have to match them with their appropriate table, graph, equation, and ordered pairs. This is an excellent review of finding the slope through multiple forms!Available in the full curriculum bundles below!Pre-Algebra - Curriculu
Subjects:
Grades:
7th - 9th
Types:
CCSS:
Also included in: Finding Slopes BUNDLE for Google Slides™

Comparing Linear Functions for Google Slides™
- Great for online and distance learning! Created to be compatible with Google Slides™!- In this digital activity, students will compare linear functions through multiple representations. They will compare the rates of change and the initial value of linear functions through equations, tables, and graphs. Students must be able to compare the magnitude of numbers ordering from least to greatest and greatest to least.- This activity includes 36 different functions to compare in magnitude over five
Subjects:
Grades:
7th - 9th
Types:
Also included in: Linear Functions - Unit 4 - BUNDLE for Google Slides™
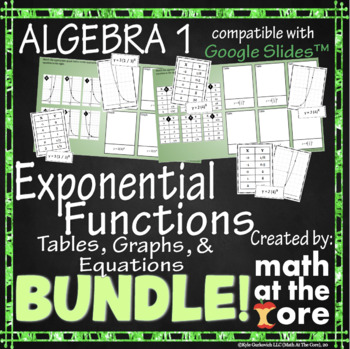
Exponential Functions BUNDLE- Tables, Graphs, & Equations for Google Slides™
This bundle includes all four Exponential Function Matching Activities- Great for online and distance learning! Created to be compatible with Google Slides™!- These digital activities include students matching 15 to 18 exponential function representations. The activities range from matching graphs to equations, tables to equations, graphs to tables, and all three combined!Available in the full curriculum bundle below!Algebra 1 - Curriculum - BUNDLE for Google Slides™- PLEASE NOTE - this download
Subjects:
Grades:
8th - 9th
Types:
CCSS:
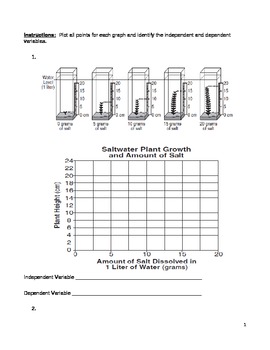
Middle School Math and Science Graphing Practice - Middle School Line Graphs
Use this resource to help your middle school math and science students learn and practice how to make line graphs as well as identify the independent and dependent variables. Move beyond bar graphs! There is a teacher key provided and eight graphs for practice.
line graph, plot points, x-axis, y-axis, independent variable, dependent variable
Subjects:
Grades:
5th - 9th
Types:
Create Population Pyramids!
OverviewStudents will understand how to read a population pyramid by creating one! This activity includes two templates to help your students create their own population pyramids, as well as population data for four countries from the U.S. Census Bureau's International Database. The activity includes blank cards if you or your students would like to create additional or specific population pyramids. Instructions are included to help navigate the U.S. Census Bureau's website in order to obtain th
Grades:
6th - 12th
Types:
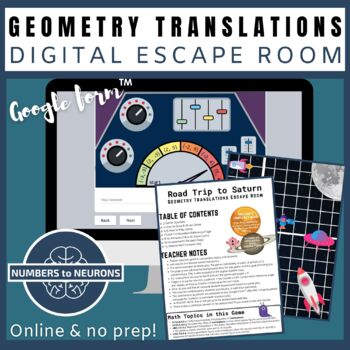
7th 8th Grade Geometric Translation Activity No Prep Geometry Escape Room
Step into the cosmic realm of geometry with our 7th 8th grade geometric translation escape room activity! No prep needed – just dive into this space-themed adventure where geometric challenges await. Navigate to Saturn, unlock clues, and solve translation puzzles to escape! Perfect for 7th & 8th graders, this digital escape room combines fun and learning.✹ THIS GEOMETRY GAME IS ZERO PREP! ✹Included in this Geometry Translations Digital Activity:✔ Alien Game Scenario✔ Instructions for How to
Grades:
7th - 9th
Types:
CCSS:
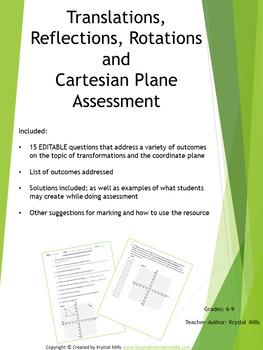
Translation, Reflection, Rotation and Cartesian Plane Test
This Translation, Reflection, Rotation, and Cartesian Plane Test can be used as a quiz, test, assignment, or formative assessment to assess your students' understanding of the Cartesian plane and Transformations. How you use this editable document (WORD file) will depend on your grade level, outcomes, learning goals, and students. Various outcomes are addressed including:-label the x and y axes and origin of a Cartesian plane-identify points on a Cartesian plane -plot points on a Cartesian plane
Subjects:
Grades:
6th - 9th
Types:
Showing 1-24 of 2,290 results


