177 results
High school graphing lessons for Microsoft Word
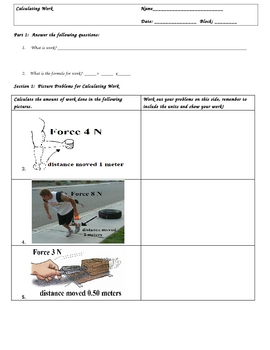
Calculating Work (W=Fxd) Worksheets and Key
Calculating Work (W=Fxd) Worksheets and KeyIf you have been teaching a Simple Machines or Energy Unit, then you need to check out this three page lesson to teach calculating work. It is in three sections.Section 1: Picture QuestionsSection 2: Word Problems/with Challenge QuestionsSection 3: Charting/Graphing ProblemsAll problems are worked out and the key is included.These worksheets include the renown Triangle Method, which has been a proven problem solver for students who struggle in math.The
Subjects:
Grades:
3rd - 12th, Higher Education, Adult Education
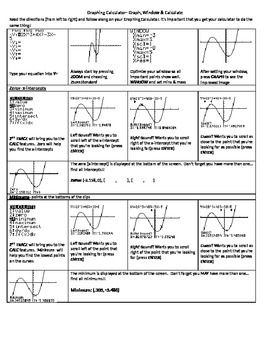
How to Graph on the Graphing Calculator
This is a worksheet designed to walk students through the process of Graphing functions, setting Windows, using tables, finding min, max, zeros, values & points of intersection with the Calculate feature. It gives directions and has screen shots so the students know what it should look like on their screen as they walk through the process. It is editable if you want to change something. It includes practice problems on what they just learned.
Made to work with TI-84 and TI-83
Subjects:
Grades:
9th - 12th
Types:

Christmas Science Lab Dissolving Candy Cane Experiment
STEM Your students will be very interested in this activity. It has become a holiday tradition that my students look forward to experiencingStudents in this laboratory activity work cooperatively to produce the desired product, make observations, and examine the effect of heat on bonding forces. They complete a written handout relating to the effect of heat on bonding and have lots of fun.The product contains 2 labs. At the conclusion, students will answer questions and complete a graph. Detai
Grades:
7th - 10th
Types:
NGSS:
MS-PS1-4
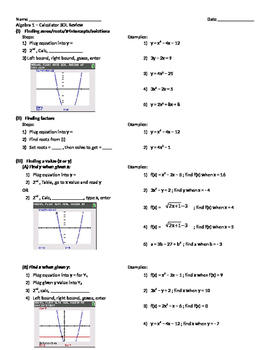
Algebra 1 Calculator Review (TI-84)
Comprehensive review of all graphing calculator concepts taught through the Algebra 1 course. Review concepts include finding roots, factors, values (x or y), y-intercept, mean, standard deviation, line/curve of best fit, and finding solutions to systems of equations. The review include steps and screenshots of the calculator.
Subjects:
Grades:
7th - 12th, Higher Education, Adult Education
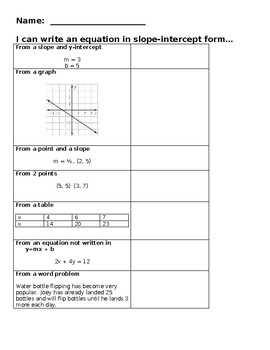
Writing Linear Equations in Slope-Intercept Form
This can be used as a quick warm-up or exit ticket to check for students ability to write equations in slope-intercept form given different information. Students are asked to write from a slope and a y-intercept, a slope and a point, two points, and a word problem. Students, also, need to rewrite an equation not given in slope-intercept form.
Subjects:
Grades:
7th - 10th
Types:
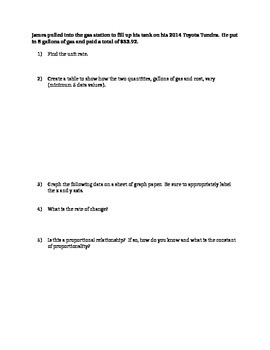
Introduction to Slope - Relating Proportional Relationships
This is to help introduce slope for the first time based on the fact that students have previous knowledge of proportional relationships. It helps them to understand that slope is the same thing as unit rate, the rate of change, and constant of proportionality. They will then brainstorm where slope is used in real life.
I used it in my 8th grade classroom to introduce slope. Previously in 7th grade, students have learned about proportional relationships and mastered the concept of unit rate.
Grades:
7th - 9th
CCSS:
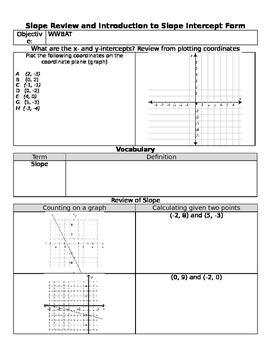
Slope Review and Discovery Introduction to Slope Intercept Form
A quick review of finding the slope of a line given two points. Also allows students to use their knowledge of slope to graph lines given various pieces of information (i.e. draw a line with a slope of 5 that includes the point 0, 3) as a means to begin connecting slope and graphing to slope intercept form. Ties in slope intercept form by having students plot points given an equation of a line and using a table to substitute values for x to find y and evaluate the results they reach.
Geometry Test Bundle
Need Geometry unit tests? Study guides? 60-minute group work? Preparation for SAT, PARCC, or other CCSS-aligned state exams? Look no further! This bundle includes TEN 25-question-long tests, most of which have 20 multiple choice and 5 short response or extended constructed response questions. All tests have an answer key included. Topics covered range pretty much the full year of a standard to advanced high school CCSS Geometry course, and major topics include:
- Definitions of Key Geometry Conc
Subjects:
Grades:
8th - 12th, Higher Education
Types:
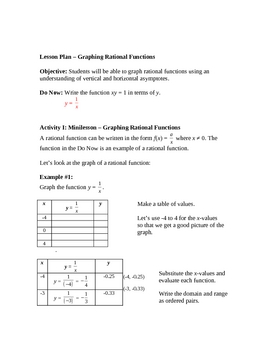
Graphing Rational Functions & Finding Asymptotes Lesson Plan
This is an introduction to graphing rational functions and explaining the graph. This lesson also explains how to find the asymptotes for the function. This lesson plan includes an opening activity, minilesson with guided steps through the process, examples, class activities and a worksheet for homework. Answer keys included. NOTE: You may need Equation Editor or MathType to make changes to some of the fractions.
Grades:
9th - 12th
Types:
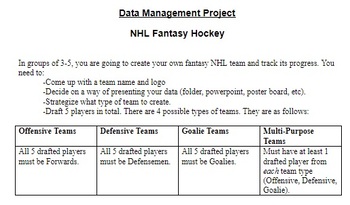
Data Management project - NHL Fantasy Hockey
This is an ongoing project that will take about 3-4 weeks to complete as it requires 10 days of data collection. Students draft a fantasy hockey team of 5 players and then they need to track certain stats, and then table and graph the results in a variety of formats. They then write a newspaper article reviewing their team's success, or lack thereof, while also looking at bias. Can be modified easily for higher or lower grades by changing the types of graphs and data used.
Subjects:
Grades:
6th - 10th
Types:
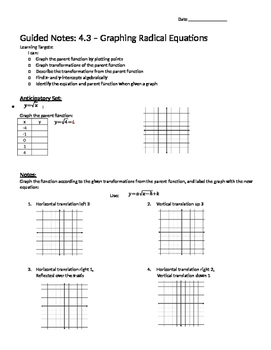
Graphing Square and Cube Root Functions - Notes
Guided notes teaching how to graph square root and cube root functions by translating the parent function. I teach my students to use the "base points" [ (0, 0), (1, 1), and (4, 2) or (-1, -1) for square/cube root] and then transform them using (h, k) or vertex form. They also must be able to determine transformations and equations from a graph. The notes are a summation of the whole unit so they must graph equations at the end and also find the domain/range as well as find x- and y-intercepts a
Subjects:
Grades:
9th - 12th, Higher Education, Adult Education
Types:
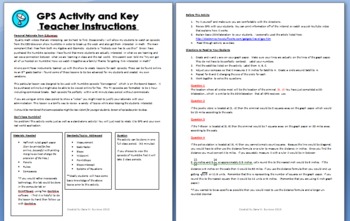
GPS Simulation - Applications of Algebra and Geometry - Aligned with Numb3rs
Are you tired of hearing your students say "When would you ever use this!?" This lesson is a perfect way to silence their complaints!
I originally designed this lesson to be used after watching the episode "Convergence"of the CBS television series Numb3rs. I think every middle/HS teacher should own copies of this series. If you aren't familiar with the show, it is basically a crime show where the characters solve crimes with math. (Similar to CSI) You might be able to download free episodes
Grades:
8th - 12th
Types:
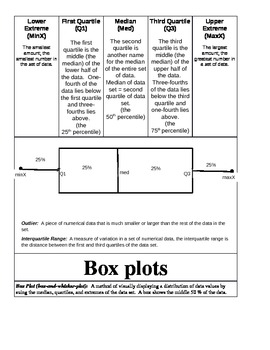
Math Interactive Notebook Box Plots Foldable
Common Core ready math interactive notebook page for Box Plots. Another in our series of foldables for middle school math. Download and use today.
Subjects:
Grades:
4th - 12th
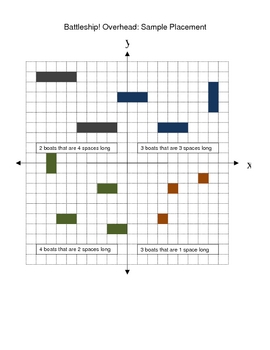
Linear Equation Battleship
This lesson provides a concrete and different context in which students can apply their skills in going between coordinate plane and algebraic representations. Students tie together these skills to assist the Navy in protecting a fleet of ships from mines (points), torpedoes (lines), and ocean sweeps (inequalities).This lesson can be used as a culminating activity, review, or an assessment. The document includes modifications and an extension activity.
Grades:
7th - 10th
Types:
Graphing Unit
This unit contains 5 separate graphing activities. In the first activity, student create a bar graph of the depths of different oceans and answer follow-up questions. In the second activity, students collect tally colors of m&ms and use this data to create a bar graph and answer questions. In the third activity students create a bar graph of the diameters of the planets and answer related questions. In the fourth activity, the laboratory activity, students record the temperature of hot water
Subjects:
Grades:
3rd - 9th
Types:
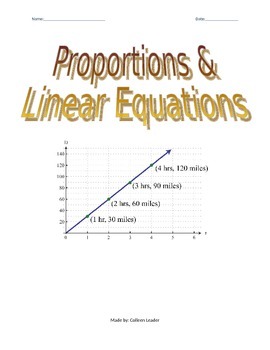
Linear Equations & Proportions
This lesson allows students to connect slope-intercept form with direct variation and proportions. Students are asked to walk through multiple tasks and then practice identifying proportional relationships from graphs and tables of data. Students also compare relationships among variables provided on graphs, equations, and tables.

Earth Day Climate Change Analysis
This lesson was intended for use on or around Earth day, to make an academic connection to the national holiday. Students will be able to create and analyze a graph that shows the data and history from past and present climate trends. This lesson incorporates science, math, and social studies skills. Students will make predictions based on their analysis. This lesson include all of the elements of a lesson plan and is aligned with the common core standards. Materials and Rubrics included.
Subjects:
Grades:
4th - 9th
Types:
Interpreting Graphs - Stock Prices & Economy (8 page Packet)
Teach students how to analyze and interpret line graphs, describe trends, and discuss data using a proven 5-step process. This is 2-3 periods of work meant to start out as teacher led and gradually moving to independent work and extension activities. All materials are found within this 16 page editable document. Various differentiation methods, scaffolding tools, and a script for teaching the lesson are included. Skill Area: Graphing/Analyzing Data/Interpreting Data/Describing Trends in Data
Subjects:
Grades:
6th - 12th
Types:
CCSS:

Geometric Transformations: Radial Art
This project is a fun, creative, and real world way to incorporate geometric transformations. In this project student will began by making a rough draft of their art work on graph paper using step by step instructions. They will perform rotations, reflections, and translations. (You can also choose to include dilations). They can answer the questions pertaining to the transformations they made.They will make a final draft of their artwork using a blank canvas or another sheet of graph paper. The
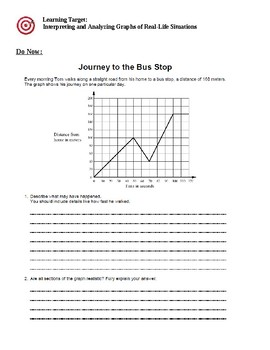
Interpreting and Analyzing Graphs of Real-Life Situations
Students will interpret graphs of real-life events; students will match events to graphs; students will create their own graph based on a given scenario
Subjects:
Grades:
7th - 10th
Types:
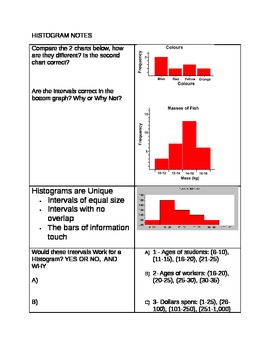
Histogram Notes
I created these notes for histograms to align with the Common Core Integrated 1 Curriculum (Unit 4 Data).
Subjects:
Grades:
7th - 11th
Types:
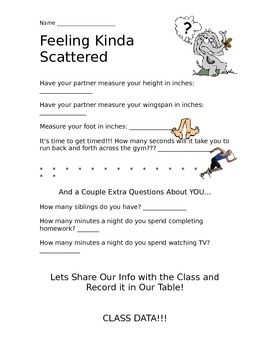
Scatter Plots Class Activity
Feeling Kinda Scattered is a fun activity that can be used as an introduced to Scatter Plots or mixed in throughout your lesson on scatter plots. Students discover different information about themselves first then share their data with the rest of the class.
Subjects:
Grades:
3rd - 10th
Types:
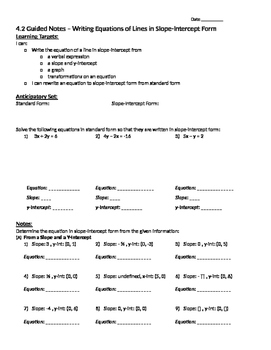
Writing Equations in Slope-Intercept Form - Notes
Guided notes teaching students how to write equations in slope-intercept form when given a graph, a slope and a y-intercept, and a verbal explanation. The notes also teach how to transform equations in slope-intercept form when given vertical shifts and "stretches" in the steepness/flatness of the line. The beginning of the notes also reviews how to find the slope-intercept form of an equation written in standard form by solving for y. I also have a corresponding assignment of the same name.
Grades:
7th - 12th, Higher Education, Adult Education
Types:
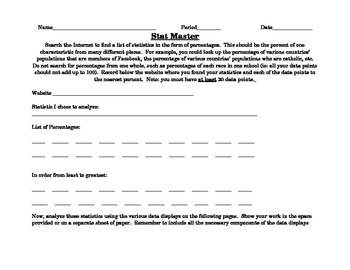
Stat Master- Statistics Analysis and Data Displays
This web-based performance task allows students to find statistics on the internet and the analyze and display the statistics using various displays. Finally, students are prompted to write about their analysis, explaining when specific displays are used and justifying their choice of a given display.
The data analysis and displays included are:
-Measures of Central Tendency (mean, median, mode)
-Measures of Variation (extremes, quartiles, or five-point summary)
-Box-and-Whisker Plot (or Box p
Subjects:
Grades:
5th - 9th
Types:
Showing 1-24 of 177 results


