167 results
High school statistics tools for common core interactive whiteboards
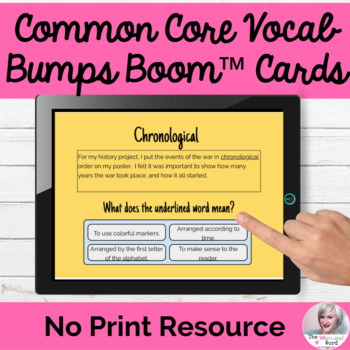
Common Core Vocabulary BOOM CARDS™ Flashcards No Print Speech|Distance Learning
Looking for an easy way to target vocabulary in context with your middle school students? Look no further! Boom Cards™ are interactive and self-checking.Common Core Vocabulary Bumps for Middle School feature 50 target words that appear in basal readers and other books commonly taught in middle school (6-8th grade). As a BOOM CARD™ deck, your students can seamlessly work through these self-grading task cards on an iPad, Chromebook or laptop as you collect data on progress! These decks are a fu
Grades:
6th - 9th
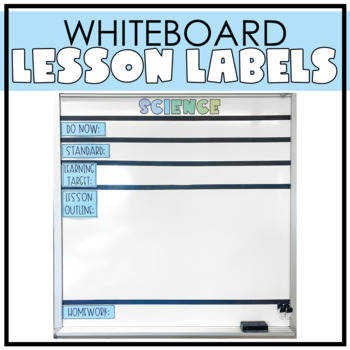
Editable Whiteboard Lesson Labels
Description: MUST HAVE POWERPOINT TO EDIT THIS RESOURCE!Do you need a way to organize and display your daily lessons? These editable whiteboard labels are a great tool for that! Put these labels on your whiteboard and use colored masking tape to divide the whiteboard into the different sections. Then write out the information for each daily lesson. My students really appreciate this resource and it encourages them to take ownership over their learning. If you are using standards based inst
Grades:
5th - 12th
Also included in: Middle School Classroom Decor & Organization- GROWING Bundle
Introduction to Probability and Statistics Lesson Plan Bundle
Elementary Statistics - Introduction to Probability and Statistics Lesson Plan BundleThis bundle includes:-Introduction to Statistics and Types of Data-Data Collection, Sampling Techniques, and Studies-Introduction to Technology in Statistics Activity-Organizing Data Using Frequency Distributions-Histograms and Dot Plots-Graphs and Charts in Statistics-Organizing and Presenting Data Using Technology Activity-Measures of Central Tendency-Measures of Position-Measures of Variation-Introduction to
Subjects:
Grades:
10th - 12th, Higher Education
Confidence Intervals and Hypothesis Testing Lesson Plan Bundle
Elementary Statistics - Confidence Intervals and Hypothesis Testing Lesson Plan BundleThis bundle includes:-Confidence Intervals for the Mean-Confidence Intervals for Proportions-Confidence Intervals for Variance and Standard Deviation-Introduction to Hypothesis Testing-Hypothesis Testing for the Mean-Hypothesis Testing for Proportions-Hypothesis Testing forVariance and Standard Deviations-Other Uses of Hypothesis Testing-Confidence Intervals and Hypothesis Testing Test-Confidence Intervals and
Subjects:
Grades:
10th - 12th, Higher Education
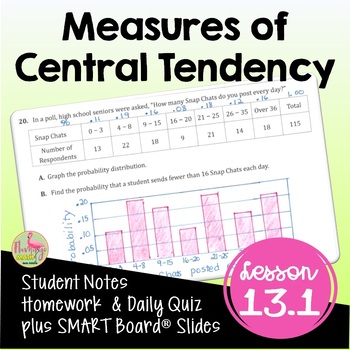
Measures of Central Tendency (Algebra 2 - Unit 13)
Measures of Central Tendency Algebra 2 Lesson:Your Pre-AP Algebra 2 Honors students will draw, analyze and interpret box-and-whisker plots, find outliers, and calculate measures of central tendency in this unit 13 lesson on Data Analysis & Statistics that cover the concepts in depth. #distancelearningtptWhat is included in this resource?⭐ Guided Student Notes⭐ Google Slides®⭐ Fully-editable SMART Board® Slides⭐ Homework/Practice assignment⭐ Lesson Warm-Up (or exit ticket)⭐Daily Content Quiz
Subjects:
Grades:
8th - 11th, Higher Education
CCSS:
Also included in: Algebra 2 Curriculum Mega Bundle | Flamingo Math

Character Traits Activity No Print Speech Therapy | Distance Learning
Are you struggling to find appropriate resources to target descriptive adjectives for your older students? This resource can help!Language For Character Traits is exactly what you need to help target common core/descriptive vocabulary in your middle and high school students. Students struggle to describe character flaws and traits in pieces of text because they often lack the accurate vocabulary. Character Trait language helps a student compare and contrast characters, provide an accurate sum
Grades:
7th - 10th

Categorize Where in the Grocery Store Digital Speech Therapy Activity
Supporting language learners who are also learning life skills? Categories are important building blocks in language, and critical for understanding how things are related and organized in the classroom and elsewhere. Help them learn how to find what they need in the grocery store with this no print resource. Works great in traditional settings, too! 41 itemsJust choose the correct grocery store aisle for each item.Each page is created for errorless learning.Buyers say:Great product, can target
Grades:
4th - 12th, Adult Education

Test Prep (Study Island Survivor Game Challenge)
My 14 year old freshman and 13 year old seventh grade twins WISH they’d been able to prepare for standardized tests in a similar way. The dreaded ‘Study Island’ can be a cooperative learning game for those who out~wonder, out~perform, and out~learn to become the ultimate Study Island survivor!
Pages 1 and 2: Introduction
Page 3: how to make
Page 4: how to play
Page 5: printable Study Island Survivor Game Challenge poster
Pages 6-9: printable tribe name posters
Page 10: printable answer cards
Pag
Grades:
1st - 12th
Types:
Probability and Counting Rules Lesson Plan Bundle
Elementary Statistics - Probability and Counting Rules Lesson Plan BundleThis bundle includes:-Introduction to Probability-Addition Rules for Probability-Multiplication Rules and Conditional Probability-Notation and Symbols in Probability-Permutations and Combinations-Application of Counting Rules-Probability and Counting Rules Test-Probability and Counting Rules Quiz (Bonus File)-Sample Space Handout (Bonus File)-Pacing Guide (Bonus File)Preview: Please refer to the above links for additional p
Subjects:
Grades:
10th - 12th, Higher Education
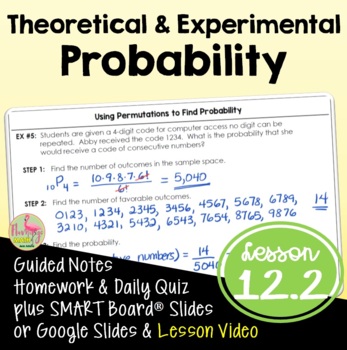
Theoretical and Experimental Probability (Algebra 2 - Unit 12)
Theoretical & Experimental Probability Algebra 2 Lesson:Your Pre-AP Algebra 2 Honors students will find both experimental and theoretical probabilities in this Unit 12 lesson. #distancelearningtptWhat is included in this resource?⭐ Guided Student Notes⭐ Google Slides®⭐ Fully-editable SMART Board® Slides⭐ Homework/Practice assignment⭐ Lesson Warm-Up (or exit ticket)⭐ Daily Content Quiz (homework check)⭐ Video Lesson Link for Distance Learning - Flipped Classroom models⭐ Full solution setStude
Subjects:
Grades:
8th - 11th, Higher Education
CCSS:
Also included in: Algebra 2 Curriculum Mega Bundle | Flamingo Math
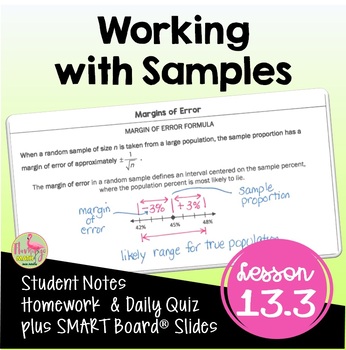
Working with Samples (Algebra 2 - Unit 13)
Working with Samples Algebra 2 Lesson:Your Pre-AP Algebra 2 Honors students will find draw, analyze and interpret box-and-whisker plots, find outliers, and calculate measures of central tendency in this unit 13 lesson on Data Analysis & Statistics that cover the concepts in depth. #distancelearningtptWhat is included in this resource?⭐ Guided Student Notes⭐ Google Slides®⭐ Fully-editable SMART Board® Slides⭐ Homework/Practice assignment⭐ Lesson Warm-Up (or exit ticket)⭐Daily Content Quiz (ho
Subjects:
Grades:
8th - 11th, Higher Education
CCSS:
Also included in: Algebra 2 Curriculum Mega Bundle | Flamingo Math
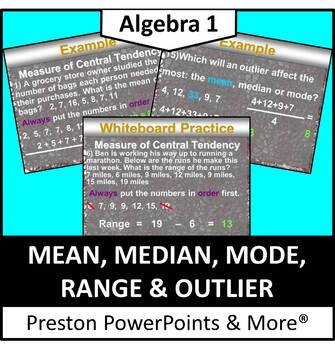
Mean, Median, Mode, Range and Outlier in a PowerPoint Presentation
Mean, Median, Mode, Range and Outlier in a PowerPoint PresentationThis slideshow lesson is very animated with a flow-through technique. It was made for my Algebra 1 class, but can be used for lower grades aw well. The lesson teaches how to solve for mean, median, mode and range. It also teaches to identify outliers in a set of data and find the measure of central tendency.NEW: The lesson is in an editable format so you can tailor the lesson to your class. The problems and clipart can’t be edit
Subjects:
Grades:
6th - 10th
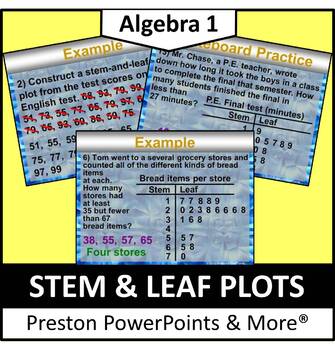
Stem and Leaf Plots in a PowerPoint Presentation
Stem and Leaf Plots in a PowerPoint PresentationThis slideshow lesson is very animated with a flow-through technique. I developed it for my Algebra 1 class, but it can be used for lower grades as well. This lesson was one of a chapter that was used as a review for all previous grades. The lesson teaches how to interpret data from the stem-and-leaf plot and make and use a stem-and-leaf plot to put data in order.NEW: The lesson is in an editable format so you can tailor the lesson to your class.
Subjects:
Grades:
6th - 9th
CCSS:
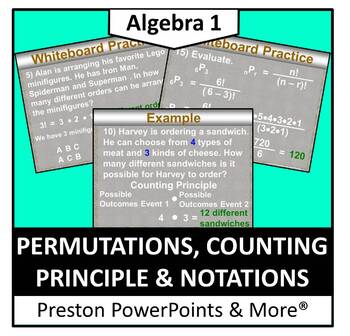
Permutations, Counting Principle and Notations in a PowerPoint
Permutations, Counting Principle and Notations in a PowerPoint PresentationThis slideshow lesson is very animated with a flow-through technique. I developed the lesson for my Algebra 1 class, but it can also be used for upper level class reviews. This lesson teaches how to find the total number of permutations, solve a combination problem, solve permutations and combination problem in notation form.NEW: The lesson is in an editable format so you can tailor the lesson to your class. The problem
Subjects:
Grades:
8th - 11th
CCSS:
Distributions of Data Lesson Plan Bundle
Elementary Statistics - Distributions of Data Lesson Plan BundleThis bundle includes:-Introduction to Probability Distributions-Mean and Standard Deviation of Probability Distributions-Binomial Distributions-The Normal Distribution-Find Z-Scores for Normal Distributions-Applications of Normal Distribution-Central Limit Theorem-Distributions of Data Test-Normal Distribution Table-Distributions of Data Quiz (Bonus File)-Pacing Guide (Bonus File)Preview: Please refer to the above links for addition
Subjects:
Grades:
10th - 12th, Higher Education

Literary Terms Jeopardy - PA/Keystone Prep
This is a PowerPoint slideshow that functions as a Jeopardy game. It can be used to teach, review, or refine some of the important terms used on the Pennsylvania State Keystone Exams. There are 25 total questions, which provide the definition and ask students to identify the literature terminology. Click anywhere on the slide for the answer to appear. Categories on the Jeopardy board include the following: Plot Diagram, Elements of Fiction, Word/Sentence Structure, Propaganda Techniques, Dram
Subjects:
Grades:
9th - 12th

Statistics animated powerpoint lesson template
Content:1.Introduction2.Discrete Data3.Continuous Data4.Central Tendancy of a Data Set5.Range and Interquartile Range6.Box and Whisker Plot
Subjects:
Grades:
8th - 9th
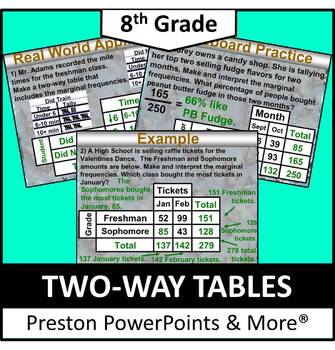
(8th) Two-Way Tables in a PowerPoint Presentation
8th Grade Math (Pre-Algebra) Two-Way Tables in a PowerPoint PresentationThis slideshow lesson is very animated with a flow-through technique. I developed the lesson for my 8th grade class, but it can also be used for upper level class reviews. This lesson teaches how to read two-way tables, make and interpret two-way tables, and use graphs to organize and solve real-life data problems, such as the most liked movie genre.This lesson has SKELETON NOTES, notes that have the problem only. I used t
Subjects:
Grades:
7th - 9th
CCSS:
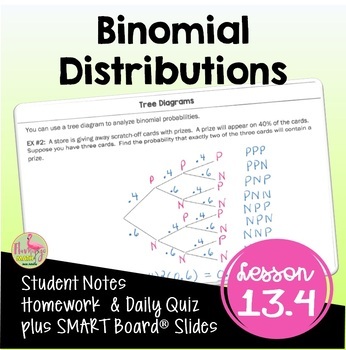
Binomial Distributions (Algebra 2 - Unit 13)
Binomial Distributions Algebra 2 Lesson:Your Pre-AP Algebra 2 Honors students will calculate measures of central tendency, draw, analyze, and interpret box-and-whisker plots and find outliers using binomial distributions in this Unit 13 lesson. #distancelearningtptWhat is included in this resource?⭐ Guided Student Notes⭐ Google Slides®⭐ Fully-editable SMART Board® Slides⭐ Homework/Practice assignment⭐ Lesson Warm-Up (or exit ticket)⭐ Daily Content Quiz (homework check)⭐ Video Lesson Link for Dis
Subjects:
Grades:
8th - 11th, Higher Education
CCSS:
Also included in: Algebra 2 Curriculum Mega Bundle | Flamingo Math

Statistics animated powerpoint template lesson part 1
Statistics animated lesson:content:1.Introduction2.Discrete Data3.Continuous Data4.Central Tendancy of a Data Set
Subjects:
Grades:
8th - 9th
Also included in: Statistics animated powerpoint lesson template
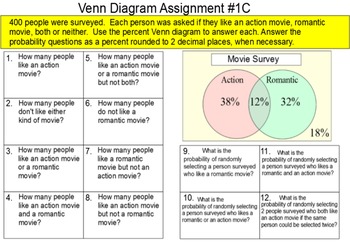
Venn Diagrams with Probability, 2 Lessons + 16 Assignments for SMART
Included in this zip folder are 19 SMART Notebook files. 2 are for instruction, 1 is a student reference handout and 13 are assignments. A brief description of each:
Instruction file #1 is a 36 slide introduction to reading a Venn diagram. Some formative assessment problems are included.
Instruction file #2 is a 25 slide introduction to the complement of a set in a Venn diagram.
Assignment A is a matching assignment. The student matches 10 2 circle Venn diagrams with union, intersection and
Subjects:
Grades:
8th - 11th
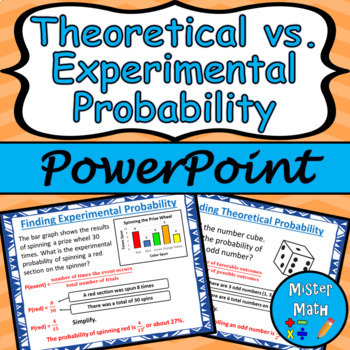
Theoretical vs. Experimental Probability PowerPoint Lesson
This is a PowerPoint Presentation to assist students in learning about theoretical and experimental probability. Students will learn the concepts of theoretical and experimental probability, as well as how to find the probabilities of each. Overall, the 21-slide PowerPoint Lesson covers the following topics:Theoretical ProbabilityUsing Theoretical ProbabilityExperimental ProbabilityMaking PredictionsComparing Theoretical & Experimental Probability Plenty of real-life examples are included to
Subjects:
Grades:
6th - 9th
Also included in: Theoretical vs. Experimental Probability PPT & Guided Notes BUNDLE
Correlation and Regression Lesson Plan Bundle
Elementary Statistics - Correlation and Regression Lesson Plan BundleThis bundle includes:-Scatter Plots and Correlation-Linear Regression-Complete Regression Analysis-Correlation and Causation-Correlation and Regression Test-Correlation and Regression Quiz (Bonus File)-Pacing Guide (Bonus File)Preview: Please refer to the above links for additional previews.Related ContentClick here to view more Elementary Statistics materialsClick here to view more Lesson Plan Bundles----Customer Tips----Get c
Subjects:
Grades:
10th - 12th, Higher Education

Statistics animated powerpoint lesson template part 2
Statistics part 2:1.Range and Interquartile Range2.Box and Whisker Plot
Subjects:
Grades:
8th - 9th
Also included in: Statistics animated powerpoint lesson template
Showing 1-24 of 167 results

