
Theoretical vs. Experimental Probability PowerPoint Lesson


- PPTX
What educators are saying
Also included in
 This BUNDLE includes a PowerPoint Lesson and a corresponding Guided Notes Packet to assist students in learning about theoretical and experimental probability. Students will learn the concepts of theoretical and experimental probability, as well as how to find the probabilities of each. Plenty of rePrice $3.75Original Price $5.25Save $1.50
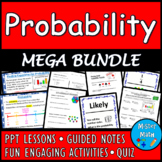 This Probability MEGA BUNDLE is just what you've been looking for to assist students in learning about likelihood, simple probability, and experimental/theoretical probability! Included in this bundle, you will find:Outcomes & Events PowerPoint LessonOutcomes & Events Guided Notes (coincidesPrice $15.99Original Price $29.70Save $13.71
Description
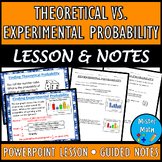
This is a PowerPoint Presentation to assist students in learning about theoretical and experimental probability. Students will learn the concepts of theoretical and experimental probability, as well as how to find the probabilities of each. Overall, the 21-slide PowerPoint Lesson covers the following topics:
- Theoretical Probability
- Using Theoretical Probability
- Experimental Probability
- Making Predictions
- Comparing Theoretical & Experimental Probability
Plenty of real-life examples are included to give students ample opportunities to practice the skills. The presentation also comes fully animated, with animations triggered by mouse click!
☆ CLICK HERE TO CHECK OUT MY OTHER POWERPOINT LESSONS!
********************************************************************************************************
Thank you so much for visiting my store! If you want to stay up-to-date on new products and sales, please click on the green ★ next to my name to follow my store!
☆ If you enjoyed this product, please leave a rating and some feedback! ☆
By leaving feedback, you can also earn TpT credits that can be applied to future purchases to save you money!!
********************************************************************************************************
Connect with me!
********************************************************************************************************
You might also be interested in:
Probability PPT & Guided Notes BUNDLE
Outcomes & Events (Probability) PowerPoint Lesson
Outcomes & Events (Probability) Guided Notes
Outcomes & Events (Probability) PowerPoint and Guided Notes BUNDLE
Playing Cards Probability Activity
Number Cube Probability Activity
Theoretical vs. Experimental Probability Guided Notes
Theoretical vs. Experimental Probability PPT & Guided Notes BUNDLE
Theoretical vs. Experimental Probability Riddle Activity
Theoretical vs. Experimental Probability Scavenger Hunt
One-Step Multiplication & Division Equations PPT and Guided Notes BUNDLE
One-Step Multiplication & Division Equations MEGA BUNDLE
One-Step Addition & Subtraction Equations PPT and Guided Notes BUNDLE
One-Step Addition & Subtraction Equations MEGA BUNDLE
Adding Integers (Using Manipulatives & Number Lines) PowerPoint Lesson
Adding Integers (Using Manipulatives & Number Lines) PPT and Guided Notes BUNDLE
Adding Integers (Using Rules) PPT & Guided Notes BUNDLE
Subtracting Integers PowerPoint & Guided Notes BUNDLE
Multiplying & Dividing Integers PPT and Guided Notes BUNDLE
********************************************************************************************************
© Copyright 2021 Mister Math, ALL RIGHTS RESERVED. Permission is granted to copy pages specifically designed for student and/or teacher use by the original purchaser or licensee ONLY. You may not share the activities with anyone else unless additional licenses are purchased. Reproducing, copying, editing, distributing, selling, or placing any part of this product on the Internet is strictly prohibited. Doing so is a violation of the Digital Millennium Copyright Act (DMCA).
