373 results
Autumn statistics outlines
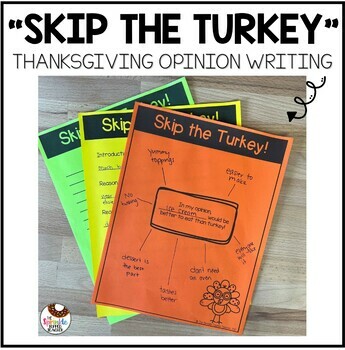
Thanksgiving Opinion Writing Activity | Skip the Turkey
Gobble your way into this turkey themed opinion writing activity! The Thanksgiving opinion writing piece includes everything you need for a super engaging writing lesson. Plus they will get extra practice with writing in a letter format. ABOUT THIS FALL OPINION WRITING PIECE:Students pretend they are the turkey! Yikes! They need to convince the farmer to change up the menu for Thanksgiving. Students will then write a letter to the farmer explaining what food item should be served instead!INCLUDE
Subjects:
Grades:
1st - 4th
Types:
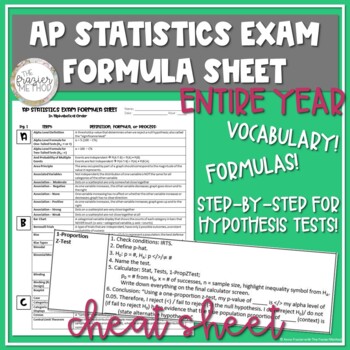
AP Statistics Review Vocabulary & Formulas for Entire Year, AP Stats Cheat Sheet
AN ENTIRE YEAR OF AP STATISTICS VOCABULARY, FORMULAS, & STEP-BY-STEP PROCESSES FOR CONFIDENCE INTERVALS AND HYPOTHESIS TESTS!!! Is AP Stats hard? Not with this all-in-one AP Statistics review of vocabulary, formulas, and step-by-step processes! Need some AP Statistics help? Use this product to help your students review for the AP Statistics Exam! This AP Statistics reference sheet includes definitions, formulas, and step-by-step processes for performing hypothesis tests and creating confiden
Subjects:
Grades:
9th - 12th
Types:
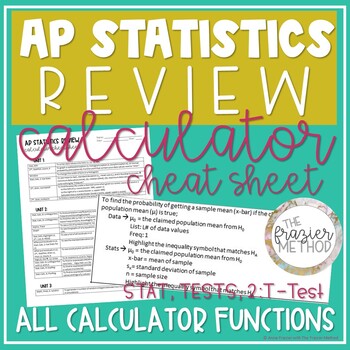
AP Statistics Review - Calculator Cheat Sheet for TI-84 Plus CE on AP Stats Exam
AN ENTIRE YEAR OF STATISTICS CALCULATOR FUNCTIONS for the TI-84 PLUS CE or TI-84 PLUS!!! Is AP Statistics hard? Not with this all-in-one AP Statistics calculator cheat sheet! Use this AP Statistics worksheet of calculator functions to help your students review for the AP Stats Exam! This AP Statistics reference sheet includes calculator functions from Units 1-7 - such as linear regression, probability formulas, graphs, re-expression, confidence intervals hypothesis tests, and more! This is a one
Subjects:
Grades:
9th - 12th, Higher Education
Types:
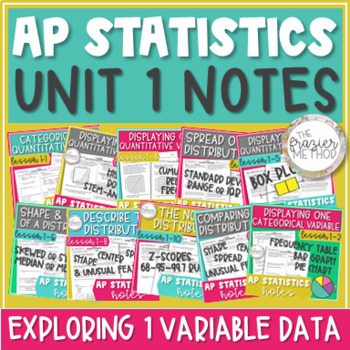
AP Statistics Notes Unit 1 Histogram, Box Plot, Skew, Mean, Normal Distribution
Use these AP® Statistics notes to teach UNIT 1 – EXPLORING ONE-VARIABLE DATA. Histograms, box plots, dot plots, stem-and-leaf plots, bar graphs, outliers, 5-number summary, z-scores, Normal Distribution / Normal Model, and describing a distribution's shape, center, & spread! Skewed or symmetric, median or mean, standard deviation or interquartile range... You can also use these notes for AP® Stats exam review! Aligns with the updated 2019-2020 objectives and standards of Unit 1: Exploring On
Subjects:
Grades:
10th - 12th
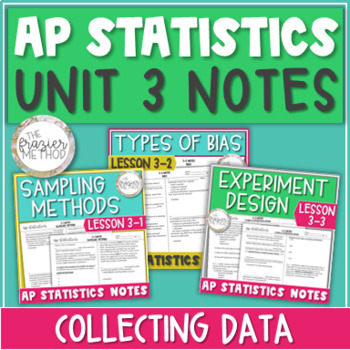
AP Statistics Notes Unit 3 Sampling Methods, Types of Bias, & Experiment Design
AP Statistics notes on SAMPLING METHODS : simple random sample, stratified sample, systematic sample, cluster sample, convenience sample... TYPES OF BIAS : undercoverage, nonresponse bias, response bias... and OBSERVATIONAL STUDIES & EXPERIMENT DESIGN : variables, treatments, control group, placebo, blocking, blinding, matched pairs, and more! Great for AP Stats Exam review! Aligns with AP College Board's updated 2019-2020 objectives and standards for AP Statistics Unit 3: Collecting Data. W
Subjects:
Grades:
10th - 12th, Higher Education
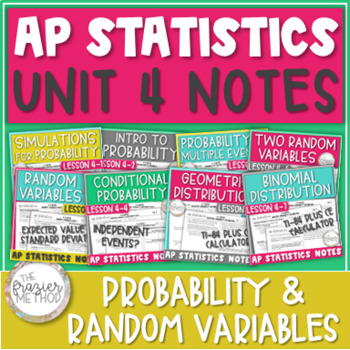
AP Statistics Notes Unit 4 Bundle - Probability Rules & Random Variables
AP Stats notes on PROBABILITY RULES : basic probability, complement, compound probability of multiple events, conditional probability, venn diagrams, simulations... RANDOM VARIABLES : expected value, standard deviation, sum and difference of two... and GEOMETRIC & BINOMIAL PROBABILITY DISTRIBUTIONS! Great for AP Statistics Exam review prep! Aligns with AP College Board's objectives and standards for AP Statistics Unit 4: Probabilities, Random Variables, & Probability Distributions. WHAT’
Subjects:
Grades:
10th - 12th
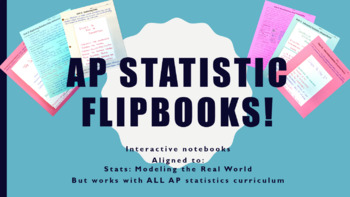
AP Statistics Flipbook Bundle! (Includes all objectives listed in 2019 CED!)
This resource has become a central focus of my class with overwhelmingly positive feedback from students, parents, and other teachers.
An interactive note page with "flipable" 3x5 cards summarizing the important data found in Bock, Velleman, De Veaux's (BVD) Stats: Modeling the World. This is applicable to ALL editions. May be used with all AP Statistics classes with minimum editing.
Included is an editable (word) document with the flipbook form (print on card stock for best results) and gradin
Subjects:
Grades:
10th - 12th
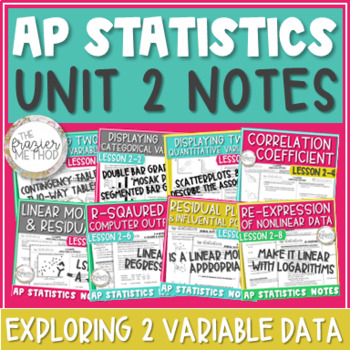
AP Statistics Notes Unit 2 Scatterplot Linear Regression Residual Two Way Table
AP® Statistics notes on UNIT 2 - EXPLORING TWO-VARIABLE DATA : contingency tables / two way tables, segmented bar graphs, scatterplots / scatter plots, correlation coefficient, linear models, residual plots, linear regression computer output, r-squared, and more! Great for AP® Stats Exam review prep! Aligns with updated 2020 objectives and standards for AP® Statistics Unit 2: Exploring Two-Variable Data. WHAT’S INCLUDED IN THIS PRODUCT?2-1 Notes - Contingency Tables2-2 Notes - Segmented Bar Grap
Subjects:
Grades:
10th - 12th
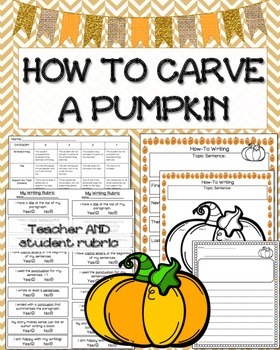
How To Carve a Pumpkin: Writing Activity
How To Carve a Pumpkin: Writing Activity
Your students will enjoy this simple writing activity on how to carve a pumpkin. Perfect for FALL! If you cover How-to writing during the month of October and November, you're in luck!
What is included?
- Steps on how to carve a pumpkin (in case your students have never carved a pumpkin or in case you forgot:D )
- 3 Brainstorming sheets
- Final Draft decorative writing paper
- Teaching Rubric
- "My Writing Rubric" - a self-check for the students!
Subjects:
Grades:
K - 5th
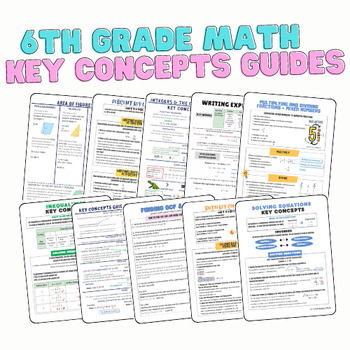
6th Grade Math: Key Concepts Guides/Anchor Charts BUNDLE
Give your students the KEY to success by purchasing this key concepts guides/anchor charts bundle. This bundle is a MUST HAVE resource for 6th grade classrooms and would also be a great one for 7th grade classrooms to have the important foundations to grow their knowledge! This bundle includes guides for ALMOST ALL 6th grade common core standards with just a few that are not addressed such as multiplying and dividing decimals using standard algorithm.Purchasing as a bundle saves you $7.50!The to

Autumn Pop Art
AUTUMN POP ARTTransform your classroom or home into a vibrant autumn art studio with these "Autumn Pop Art Coloring Pages." This captivating collection of meticulously designed coloring pages infuses the essence of fall with the dynamic flair of Pop Art, creating a delightful and educational resource for artists of all ages.Each coloring page showcases iconic autumn elements, from colorful leaves and pumpkins to umbrellas and mugs of hot cocoa. What sets these pages apart is their fusion of bold
Subjects:
Grades:
PreK - 8th
Types:
Also included in: Autumn Coloring Pages Bundle - Fun & Differnt Art Styles For Fall
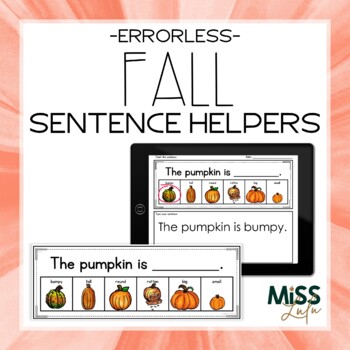
Fall Errorless Sentence Helpers - Printable and Digital
Do your students struggle to write complete sentences that make sense? These Sentence Helpers are designed to provide scaffolded instruction for students with disabilities, beginning with errorless teaching and eventually fading prompting for student's to generate their own sentences. This product includes 16 different fall themed sentence helpers, each at three phases. A digital version is also included. Students can open the file with Google Slides, drag the circle to choose the word to comple
Subjects:
Grades:
K - 2nd
Types:
Also included in: Seasonal Errorless Sentence Helpers Bundle + Google Slides
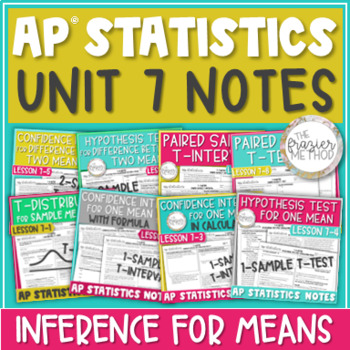
AP Statistics Notes Unit 7 Confidence Intervals & Hypothesis Tests for Means
8 AP® Statistics Notes on CONFIDENCE INTERVALS & HYPOTHESIS TESTS FOR SAMPLE MEANS. Through definitions, examples, and AP Stats FRQs, these notes teach through T-Distribution / T-Model, 1-Sample T-Interval, 1-Sample T-Test, 2-Sample T-Interval, 2-Sample T-Test, Paired Sample T-Interval, and Paired Sample T-Test. Each confidence interval and hypothesis test is taught by-hand with its formula and with its TI-84 Plus CE Calculator function. You can also use this bundle for AP® Statistics Exam p
Subjects:
Grades:
10th - 12th
Types:
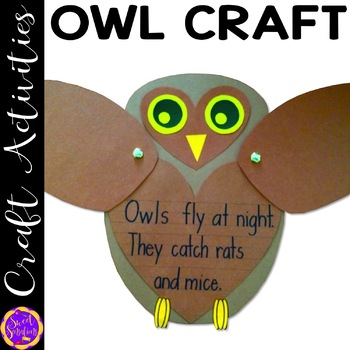
Owl Craft | Fall Crafts | Forest Crafts | Halloween Bulletin Board
Easy to make owl craft - perfect for a fall bulletin board. Run on construction paper or scrapbook paper and let students create their new breed of owl! Includes step-by-step directions and all templates. Students can write in the facts they have learned on the owl's tummy!Click here to buy as part of a Fall Craft Bundle (owl, bat, turkey, Christopher Columbus and scarecrow).What's Included: (Check out the preview for a closer look)Step-by-step directions with photographs - perfect for putting
Grades:
K - 2nd
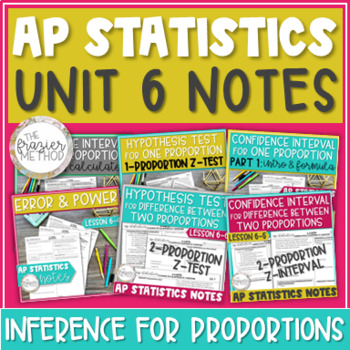
AP Statistics Unit 6 Notes Confidence Interval & Hypothesis Test for Proportions
AP Stats Notes on CONFIDENCE INTERVALS & HYPOTHESIS TESTS FOR PROPORTIONS! 1-Proportion Z-Interval, 1-Proportion Z-Test, Type 1 & 2 Errors, the Power of a Significance Test, 2-Proportion Z-Interval, and 2-Proportion Z-Test... each taught by-hand with its formula and with its TI-84 Plus CE Calculator function. Great for AP Stats Exam prep! Includes AP Stats FRQs! Aligns with AP College Board's updated 2019-2020 objectives and standards for AP Statistics Unit 6: Inference for Categorical
Subjects:
Grades:
10th - 12th
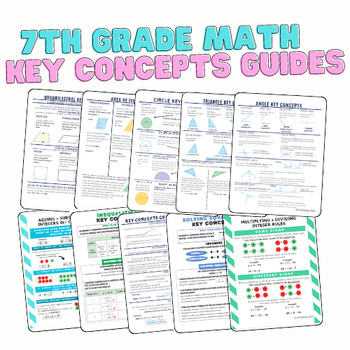
7th Grade Key Concepts Guides/Anchor Charts: BUNDLE
Give your students the KEY to success by purchasing this key concepts guides/anchor charts bundle. This bundle is a MUST HAVE resource for 7th grade classrooms and would also be a great one for 8th grade classrooms to have the important foundations to grow their knowledge!Purchasing as a bundle saves you $7.00!The topics included in this bundle are:1. Adding and Subtracting Integers2. Multiplying and Dividing Integers3. Solving and Writing Equations4. Solving and Graphing Inequalities5. Circles:
Subjects:
Grades:
6th - 8th
Types:
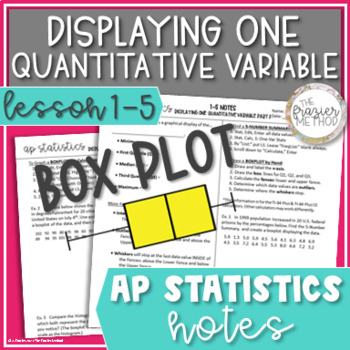
AP Statistics Notes Box Plot / Boxplot, Quartile, IQR, Outlier, 5 Number Summary
AP Stats notes to teach or review BOXPLOTS / BOX PLOTS / BOX-AND-WHISKER PLOTS! Define & calculate the median, interquartile range, 5-Number Summary, minimum, maximum, first quartile (Q1), third quartile (Q3), and percentiles for a set of data. Also, determine which data values are outliers based on the upper fence and lower fence of a boxplot. Students will graph box plots by hand given just a few of the data values and with step-by-step TI-84 Plus CE Calculator directions given the full li
Subjects:
Grades:
9th - 12th
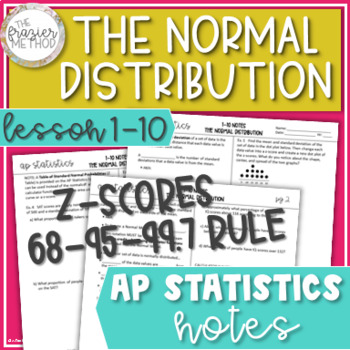
AP Statistics Notes Normal Distribution Z-Scores Empirical Rule Normal Model
Great AP Stats notes on the NORMAL DISTRIBUTION & Z-SCORES! Students will use the Normal Model and Empirical Rule (68-95-99.7% Rule) to find a data value, calculate z-scores, and find the area under the Normal curve using both the z-score formula and TI-84 Plus CE calculator functions. Students will also interpret z-scores in context, write the Normal Model notation N(µ, σ), and determine whether a data value can be considered “unusual.” Perfect for AP Stats Exam review prep! Aligns with AP
Subjects:
Grades:
9th - 12th
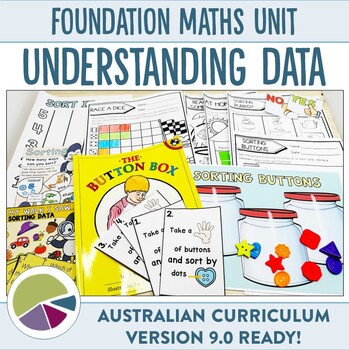
Australian Curriculum 9.0 Foundation Maths Unit Data
Help your students explore the use of data with this unit plan and activity bundle. Bring your maths lessons to life as the unit plan walks you through everything you need to thoroughly cover the AC9MFST01 element of the Australian Foundation Maths curriculum (version 9.0). Fun for students, easy for you to implement and an irresistible way to help budding mathematicians collect, sort and compare data!Bring the fun back into learning about data as you guide your students through the following Au
Subjects:
Grades:
PreK - 1st
Types:
Also included in: Ultimate Australian Curriculum 9.0 Foundation Units Bundle
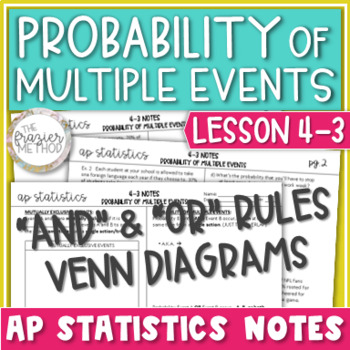
AP Statistics Notes Compound Probability of Multiple Events & Mutually Exclusive
AP Statistics notes on COMPOUND PROBABILITY OF MULTIPLE EVENTS / AND & OR PROBABILITY RULES with VENN DIAGRAMS and Mutually Exclusive Events! Students will define and calculate the probability of Events A AND B, the probability of Events A OR B, and the probability of an event’s complement. Students will also determine whether events are MUTUALLY EXCLUSIVE. Use these notes pages as AP Stats Exam review prep! Aligns with AP College Board's objectives and standards for AP Statistics Unit 4: Pr
Subjects:
Grades:
10th - 12th
Also included in: AP Statistics Notes Unit 4 Bundle - Probability Rules & Random Variables
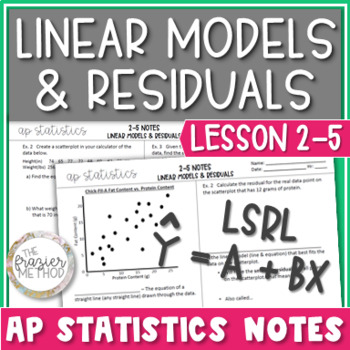
Linear Models & Residuals / Regression Line of Best Fit - AP Statistics Notes
AP Stats Notes on LINEAR MODELS & RESIDUALS. Write the equation of a linear regression model from a list of data values and use step-by-step TI-84 Plus CE Calculator directions to find the equation of the Line of Best Fit / Least Squares Regression Line (LSRL). With formulas and the regression equation, calculate residuals (e), predicated values (y-hat), y-intercept, & slope of the linear model. Templates for “interpret in context” questions are also included! Great AP Stats Exam prep! A
Subjects:
Grades:
10th - 12th
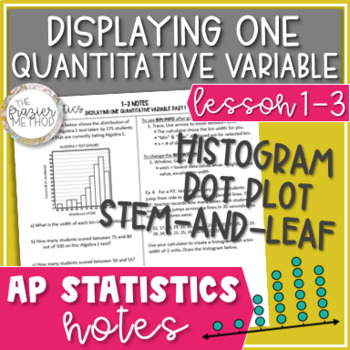
AP Statistics Notes Histograms, Dot Plots, & Stem-and-Leaf Plots - Data Displays
AP Stats notes to teach or review graphing and reading DOT PLOTS, STEM-AND-LEAF PLOTS, & HISTOGRAMS! Students will graph histograms using a TI-84 Plus CE Calculator and graph a dot plot and stem-and-leaf plot by hand. Practice problems and examples include answering questions about a set of data values displayed in a histogram. Great for AP Stats Exam prep! Aligns with AP College Board's updated 2019-2020 objectives and standards for AP Statistics Unit 1: Exploring One-Variable Data. WHAT’S
Subjects:
Grades:
9th - 12th
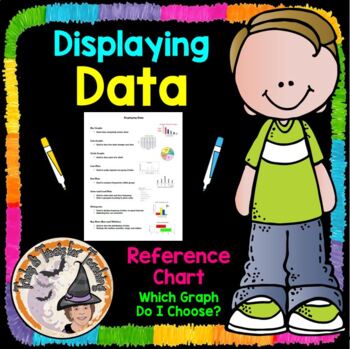
Displaying Data Reference Chart Notes Which Graph Do I Choose?
Math Teachers ~ You'll LOVE this Displaying-Data, Which-Graph-Do-I-Choose? Data-Display Reference-Chart will be SUPER helpful to your students in helping them determine which graph to choose, and provides a quick visual picture to remind them what that particular graph looks like. I printed one of these for each of my students to put inside their Math Toolkit Notebook, to use as a Reference for Data Displays Charts and Graphs. You'll enjoy using this year after year!Be sure to L@@K at my other 1
Subjects:
Grades:
5th - 8th
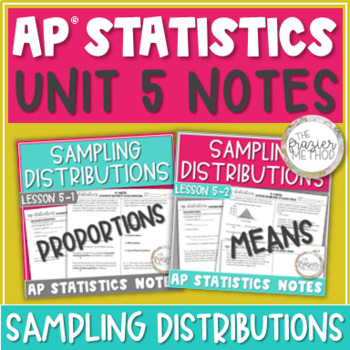
AP Statistics Notes - UNIT 5 BUNDLE - Sampling Distributions Proportions & Means
These AP Statistics notes will help you teach or review SAMPLING DISTRIBUTIONS FOR SAMPLE PROPORTIONS & SAMPLE MEANS! You can also use these notes pages to help your students review for the AP Statistics Exam! Aligns with AP College Board's objectives and standards for AP Statistics Unit 5: Sampling Distributions. WHAT’S INCLUDED IN THIS PRODUCT?5-1 Sampling Distributions of Sample Proportions2 Pages, Blank Pages & Answer KeyIntroduces sampling distributions and sampling distributions of
Subjects:
Grades:
10th - 12th
Showing 1-24 of 373 results


