232 results
Graphing outlines for Microsoft OneDrive
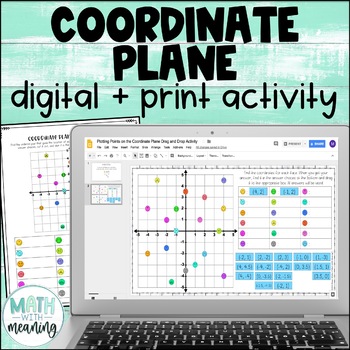
Coordinate Plane Activity - Digital and Print - Plotting Points 4 Quadrants
Looking for a fun way for students to practice using the coordinate plane? Students will practice writing ordered pairs for points on the coordinate plane with this no-prep digital activity! Students will find the ordered pairs for 18 colorful emoji faces on the coordinate plane.The ordered pairs do include decimals (halves only). Please view the preview file to make sure that this activity is appropriate for your students. This product includes the following:A link to the digital activity on Go
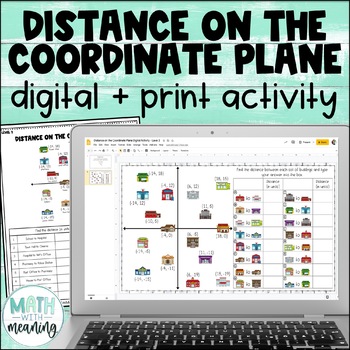
Distance on the Coordinate Plane Digital and Print Activity
Looking for an engaging, no-prep activity to practice finding distance between points on the coordinate plane? Students will find the distance between sets of buildings on a town map with this fun digital and print activity.There are 3 different levels of this activity included:Level 1: Points are shown on a coordinate plane with grid lines and axes go from -5 to 5Level 2: Points are shown on a coordinate plane with no grid lines and axes go from -20 to 20Level 3: Points are not shown on the coo
Subjects:
Grades:
5th - 8th
CCSS:
Also included in: Middle School Math Digital and Print Activity Bundle Volume 3

Exponential Functions Introduction Activity in Digital and Printable
Engage students with this intro lesson that will get them thinking exponentially.Included in download:Would you rather? Choices to get students thinking (PDF and Google Forms Poll included)Table and Graph for students to explore linear vs. exponential results of the given choices (printable PDF, Google Sheets, and Microsoft Excel versions included)Answer KeyExponential functions are a difficult concept for students because they are used to thinking about linear relations. Before telling students
Grades:
8th - 9th
Types:
CCSS:
Also included in: Algebra 1 Discovery Lessons and Inquiry Activities Bundle

Coordinate Plane Ordered Pairs DIGITAL Puzzle Pixel Art
#touchdown23Students will write the ordered pair for each dot in this self-checking activity. As the questions are answers correctly, the answers will turn green and parts of the puzzle will appear. This activity includes 12 self-checking problems.If the question is answered incorrectly, the answer will turn red. No puzzle pieces will appear for that answer if it incorrect. This activity is ready to be used as soon as you purchase! As soon as you add it to your Google Drive it is ready to be ass
Grades:
5th - 6th
CCSS:
Also included in: 6th Grade Digital Activities Bundle | Distance Learning
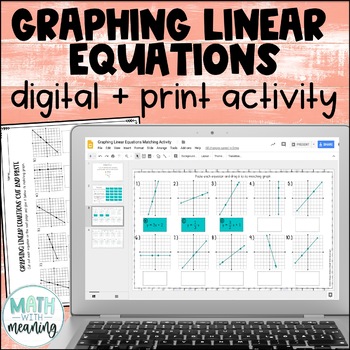
Graphing Linear Equations Digital and Print Activity for Google Drive
Looking for an engaging, no-prep activity to practice matching linear equations to their graphs? Students will match 20 equations to their graphs with this fun digital and print activity. Many of the equations are very similar and involve the same numbers, so students will need to work carefully!All equations are written in slope-intercept form. The graphs include positive, negative, zero, and undefined slopes. Please view the preview file to make sure that this activity is appropriate for your
Grades:
6th - 9th
CCSS:
Also included in: Middle School Math Digital and Print Activity Bundle Volume 2
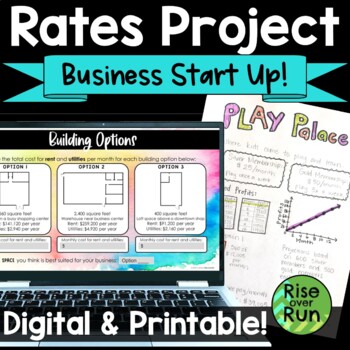
Rates & Proportional Relationships Real World Project
Students work with real world rate of change and proportional relations as entrepreneurs creating a business startup! They will love getting creative, and you will love that everything is ready to go to get them thinking about math. This project is included in printable PDF version, Google Slides, and PowerPoint.In this project, students get creative as they decide on a type of business, membership fees, and a building location. Then they must calculate their costs and profits based on those dec
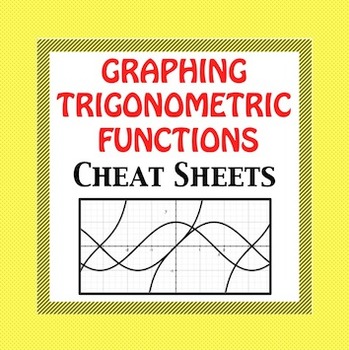
Trig Functions - Graphing Cheat Sheet
Trig Functions - Graphing Cheat Sheet*****UPDATED with different formula versions******Text books make graphing trig functions so complicated. I have simplified the process so that even below average students can follow the process easily and graph trig functions without frustration. I have passed these trig notes out to absent students and NO explanation was necessary! Trig graph paper also is included.The different versions use different formulas and variables.y = asin(bx−c)+d y = asi
Subjects:
Grades:
10th - 12th, Higher Education, Adult Education
Types:
Linear Functions
Linear Functions
This is a great one page cheat sheet on the following three forms of a line...
Intercept Form, Point Slope Form, and Standard Form
Also included, is how to find intercepts and slopes.
Two sheets are included, one in color and the other in black and white.
Easily made into a tri-foldable.
Connect with Me
Follow my WebsiteMath to the Core on FacebookMath to the Core BlogMath to the Core on PinterestMath to the Core on TwitterMath to the Core on Instagram
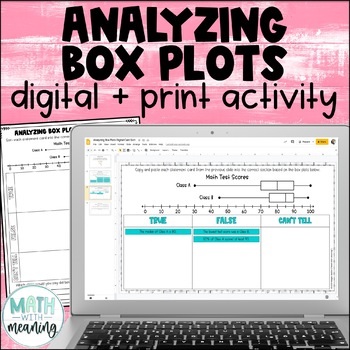
Box and Whisker Plot Digital and Print Card Sort - Reading and Analyzing
Looking for an engaging, no-prep activity to practice reading and analyzing box plots? Students will look at a double box plot and determine if statements about it are true, false, or if they can't tell from the information given in this fun digital and print activity.This activity includes statements about the minimum, maximum, median, quartile 1 (Q1), quartile 3 (Q3), interquartile range (IQR), and range of the box plots, along with statements about the percentages represented by a particular
Subjects:
Grades:
6th - 9th
Also included in: Middle School Math Digital and Print Activity Bundle Volume 3
Go Math Grade 3 Chapter 2 Slides
Powerpoint/Slides based on Go Math, Grade 3, Chapter 2.
ALL LESSONS (2.1-2.7)
During Chapter 2, students will learn about data- how it is organize and how to create bar graphs, picture graphs, and line graphs.
-Lesson topic
-Problem of the Day
-Common Core standards
-I Can statement (with visuals)
-Fluency Practice/ Math Drills
-Vocabulary
-Easy to follow lesson through the workshop model (I do, We Do, You Do)
-Turn and Talks
-An option for reteach
-Problem Solving
-Share/Reflection
-Ex
Subjects:
Grades:
3rd
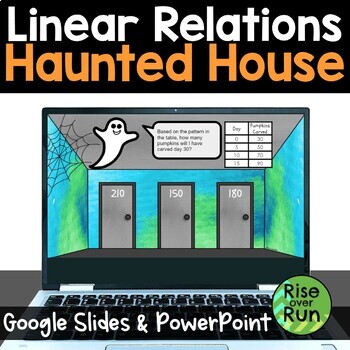
Digital Linear Relationships Halloween Escape Room Activity
Students will love this engaging practice activity for linear relationships. They must try to escape a haunted house! Includes Google Slides and PowerPoint versions. They are given 14 problems to solve, choosing from 3 possible answers for each one. If they solve correctly, they will choose the correct door and avoid the scary giant spiders! If they make a mistake, a spider appears, and they are prompted to try again. Problems include linear graphs, table of values, equations, and stories. Thi
Grades:
7th - 9th
Types:
CCSS:
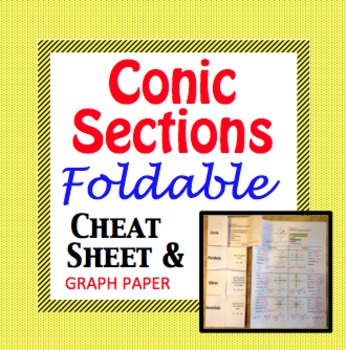
Conic Sections Cheat Sheet - Foldable for Circle, Parabola, Ellipse, Hyperbola
Conic Sections Cheat Sheet - Foldable for Circle, Parabola, Ellipse, and Hyperbola. Graph paper included!
*** UPDATED *** Now with highlighted a,b, and c lengths AND a version with parametric equations.
Create a foldable or just pass out the Conic cheat sheet, the choice is yours.
Please view my free preview.
I also use the unfilled conic foldable as a quiz or pretest warmup.
This is a comprehensive guide to the 4 conic sections (circle, parabola, ellipse, and hyperbola).
This file inc
Subjects:
Grades:
9th - 12th, Higher Education, Adult Education
Types:
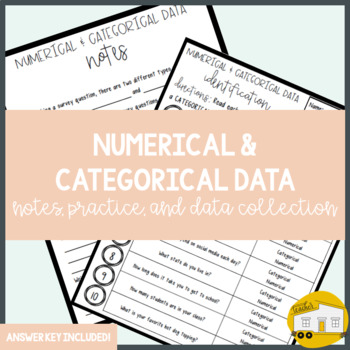
Numerical & Categorical Data - Notes, Practice, and Application!
Help students understand the difference between Numerical and Categorical Data as you discuss their explicit meanings through notes. Reinforce the concepts and make it real-life for students as they create their own survey questions and survey their classmates! ✨ print-and-go...no prep required!✨ answer keys included!✨ engaging activities!This resource can be used to:✔️ introduce the concept for the first time, or✔️ review this topic in a fun way!_______________________________________Reviews fr
Subjects:
Grades:
3rd - 6th
Types:
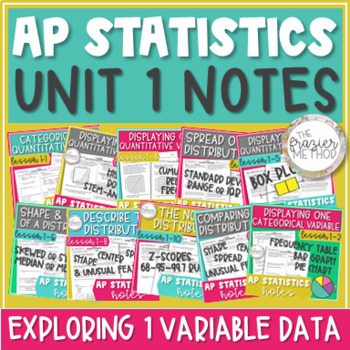
AP Statistics Notes Unit 1 Histogram, Box Plot, Skew, Mean, Normal Distribution
Use these AP® Statistics notes to teach UNIT 1 – EXPLORING ONE-VARIABLE DATA. Histograms, box plots, dot plots, stem-and-leaf plots, bar graphs, outliers, 5-number summary, z-scores, Normal Distribution / Normal Model, and describing a distribution's shape, center, & spread! Skewed or symmetric, median or mean, standard deviation or interquartile range... You can also use these notes for AP® Stats exam review! Aligns with the updated 2019-2020 objectives and standards of Unit 1: Exploring On
Subjects:
Grades:
10th - 12th

Quadratic Equation
Quadratic Equation
Quadratic Function Cheat Sheet - Foldable for the Equation of a Parabola
UPDATED - Now with a fill in the blank version. Perfect for note taking or a quiz.
This is a great one page cheat sheet on the following three forms of a parabola...
Intercept Form, Vertex Form, and Standard Forms.
Details regarding maximum, minimum and intercepts included.
Easily made into a tri-foldable.
Products you may also like...
Quadratic/Parabola Function Graph Trasformation - Card Ma

Slope Digital Math Escape Room Activity for Halloween
Students will love this fun practice activity for calculating slope between 2 points. Answering correctly will help them escape a haunted house! Includes Google Slides and PowerPoint versions. They are given 14 problems to solve, choosing from 3 possible answers for each one. If they solve correctly, they will choose the correct door and avoid the scary giant spiders! If they make a mistake, a spider appears, and they are prompted to try again. For each problem, students are given two ordere
Grades:
7th - 9th
Types:
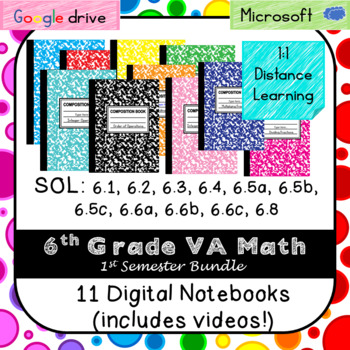
Digital Notebook BUNDLE (VA 6.1, 6.2, 6.3. 6.4, 6.5, 6.6, 6.8)
Get this BUNDLE and save 15%! Includes: SOL 6.1, 6.2, 6.3, 6.4, 6.6a, 6.6b, 6.6c, 6.5abc, and 6.8. Aligned specifically for Virginia teachers, this covers the first semester (most counties). Distance education, 1:1, and works with both Google Slides(TM) and Microsoft OneDrive (TM). This resource was created especially for Virginia teachers and aligns with SOLs 6.1, 6.2, 6.3, 6.4, 6.5, 6.6, and 6.8. A 14-page instructional "how-to" is provided with pictures that explains how to upload, assign,
Subjects:
Grades:
6th
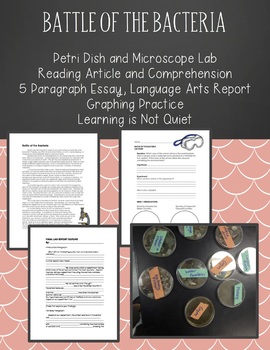
Battle of the Bacteria Cells Petri Dishes (Article, experiment, report)
Battle of the Bacteria Video / Lesson Plan Explained: https://www.youtube.com/watch?v=OAXqaKTLoRcWhether you teach upper elementary or middle school, it can be difficult to fit all of the subjects in a given day. With this activity, it makes it simple to teach math, writing, reading, health, and of course science together with one experiment. (I have done this activity as a 5th grade and 7th grade teacher).In this activity, students go throughout the school and collect samples of places that t
Subjects:
Grades:
5th - 7th
Types:
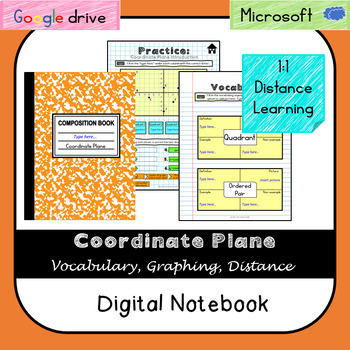
Coordinate Plane Digital Notebook (VA SOL 6.8) Distance Learning- Videos
Distance education, 1:1, and works with both Google Slides(TM) and Microsoft OneDrive (TM). This resource was created especially for Virginia teachers and aligns with SOL 6.8ab. Students will learn about vocabulary of the coordinate plane, how to graph and identify points on the coordinate plane, the difference between vertical/horizontal lines, and distance on the coordinate plane. A 14-page instructional "how-to" is provided with pictures that explains how to upload, assign, and grade this dig
Grades:
6th
Also included in: Digital Notebook BUNDLE (VA 6.1, 6.2, 6.3. 6.4, 6.5, 6.6, 6.8)
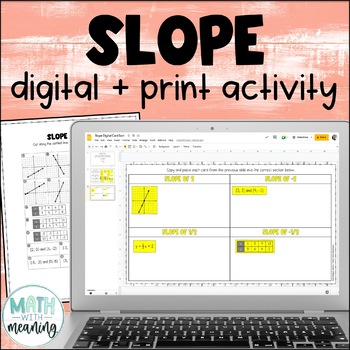
Finding Slope from Graphs, Tables, Equations, and Points Digital Card Sort
Looking for an engaging, no-prep activity to practice finding the slope when given a graph, equation, table, or two points? Students will sort 22 cards based on their slope in this fun digital and print card sort activity.Each problem gives either a table, a graph, two points, or an equation in slope-intercept form and asks students to find the slope. Please view the preview file to make sure that this resource is appropriate for your students.This product includes the following:A link to the ac
Grades:
6th - 9th
Also included in: Middle School Math Digital and Print Activity Bundle Volume 3
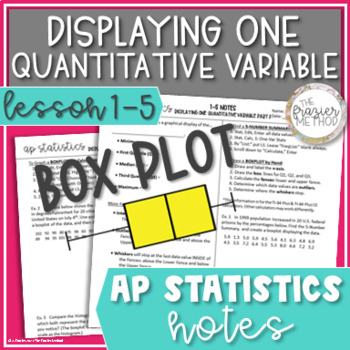
AP Statistics Notes Box Plot / Boxplot, Quartile, IQR, Outlier, 5 Number Summary
AP Stats notes to teach or review BOXPLOTS / BOX PLOTS / BOX-AND-WHISKER PLOTS! Define & calculate the median, interquartile range, 5-Number Summary, minimum, maximum, first quartile (Q1), third quartile (Q3), and percentiles for a set of data. Also, determine which data values are outliers based on the upper fence and lower fence of a boxplot. Students will graph box plots by hand given just a few of the data values and with step-by-step TI-84 Plus CE Calculator directions given the full li
Subjects:
Grades:
9th - 12th
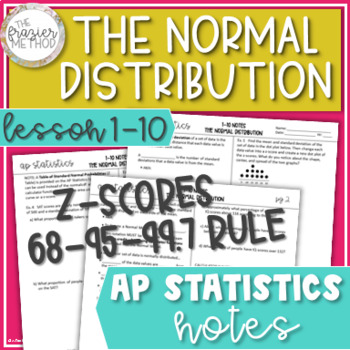
AP Statistics Notes Normal Distribution Z-Scores Empirical Rule Normal Model
Great AP Stats notes on the NORMAL DISTRIBUTION & Z-SCORES! Students will use the Normal Model and Empirical Rule (68-95-99.7% Rule) to find a data value, calculate z-scores, and find the area under the Normal curve using both the z-score formula and TI-84 Plus CE calculator functions. Students will also interpret z-scores in context, write the Normal Model notation N(µ, σ), and determine whether a data value can be considered “unusual.” Perfect for AP Stats Exam review prep! Aligns with AP
Subjects:
Grades:
9th - 12th
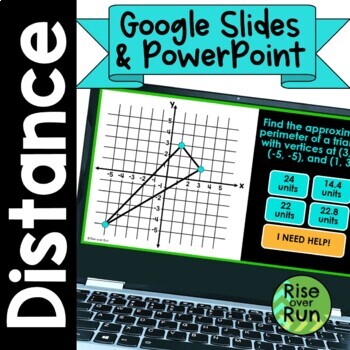
Distance Between 2 Points Practice PowerPoint & Google Slides
Students use the Pythagorean Theorem to find distances between points on a coordinate grid in this no-prep, self-checking activity. Four types of problems are included:Distance between 2 points on a graphDistance between 2 points sketched (for large numbers)Perimeter of polygons on a graphReal world map application problemsSolutions are in the format of whole numbers, decimals, roots, and rounded approximations. Problems range from very basic to challenging!16 problems are included. Each one is
Grades:
8th - 10th
Types:
Also included in: 8th Grade Geometry Unit Activities and Lessons
End Behavior of Polynomials Cheat Sheet or Foldable
End Behavior of Polynomials Cheat Sheet or Foldable.
Create a foldable or just pass out the End Behavior cheat sheet, the choice is yours.
I have found that this is the BEST way to teach end behavior.
Your students will understand this concept in 5 minutes guaranteed!!! If they do not, then please let me know!
5 pages included.
Front of End Behavior Foldable
Inside of End Behavior Foldable
One page Cheat Sheet Fillable
One page Cheat Sheet Filled
One page Cheat Sheet Filled (slight variati
Subjects:
Grades:
9th - 12th, Higher Education, Adult Education
Types:
Showing 1-24 of 232 results


