228 results
High school graphing homeschool curricula for Microsoft OneDrive

Exponential Functions Introduction Activity in Digital and Printable
Engage students with this intro lesson that will get them thinking exponentially.Included in download:Would you rather? Choices to get students thinking (PDF and Google Forms Poll included)Table and Graph for students to explore linear vs. exponential results of the given choices (printable PDF, Google Sheets, and Microsoft Excel versions included)Answer KeyExponential functions are a difficult concept for students because they are used to thinking about linear relations. Before telling students
Grades:
8th - 9th
Types:
CCSS:
Also included in: Algebra 1 Discovery Lessons and Inquiry Activities Bundle
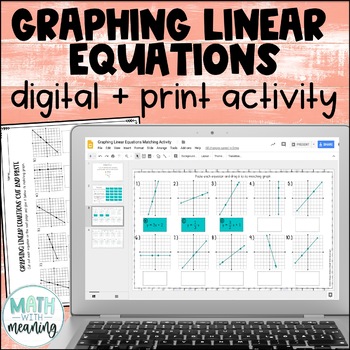
Graphing Linear Equations Digital and Print Activity for Google Drive
Looking for an engaging, no-prep activity to practice matching linear equations to their graphs? Students will match 20 equations to their graphs with this fun digital and print activity. Many of the equations are very similar and involve the same numbers, so students will need to work carefully!All equations are written in slope-intercept form. The graphs include positive, negative, zero, and undefined slopes. Please view the preview file to make sure that this activity is appropriate for your
Grades:
6th - 9th
CCSS:
Also included in: Middle School Math Digital and Print Activity Bundle Volume 2
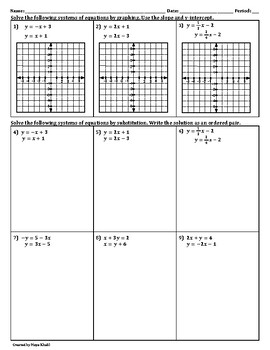
One Solution, No Solution, Infinitely Many Solutions - Two separate worksheets
Two versions are included in this practice. In the first version, problems (1 - 3) are all in slope-intercept form for easy graphing and problems (4 - 9) are solved for one variable for easy substitution. Problems (1 - 3) are identical to problems (4 - 6); repeated so that students could see how the solution to these systems looks like both graphically and algebraically. In the second version, four of the problems require solving for a variable with problems (1 - 3) also being identical to (4 -
Grades:
8th - 11th
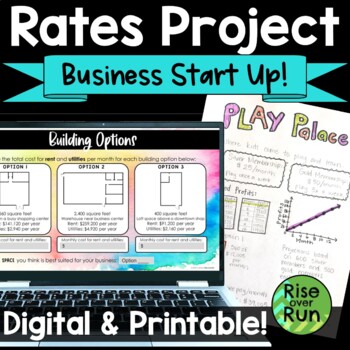
Rates & Proportional Relationships Real World Project
Students work with real world rate of change and proportional relations as entrepreneurs creating a business startup! They will love getting creative, and you will love that everything is ready to go to get them thinking about math. This project is included in printable PDF version, Google Slides, and PowerPoint.In this project, students get creative as they decide on a type of business, membership fees, and a building location. Then they must calculate their costs and profits based on those dec
Algebra 1 Curriculum
Get a complete High School Algebra 1 curriculum including units on solving equations and inequalities, linear functions, exponents and exponential functions, factoring polynomials, quadratics, and more! These ready-to-use Algebra 1 resources include everything you need to teach high school algebra to your on-level or lower-level/special education class. Supplements would be needed for an honors class.Each unit contains guided notes, practice worksheets for the classroom and/or homework, activiti
Grades:
8th - 11th
CCSS:
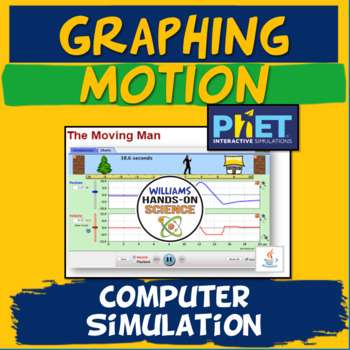
Graphing Motion MS-PS2-2: PhET Simulation: Moving Man Activity
Moving Man is a great way for your students to understand graphing motion and have fun while doing it! I’ve done this lab for years and my students are always engaged and have a much greater grasp of how motion looks on a graph. PhET simulations are my go-to when it comes to online simulations. You will need a computer and the correct software (system requirements: https://phet.colorado.edu/en/help-center/running-sims).You get the key and 4 pages of simulations and questions that involve the stu
Subjects:
Grades:
6th - 12th
Types:
NGSS:
MS-PS2-2
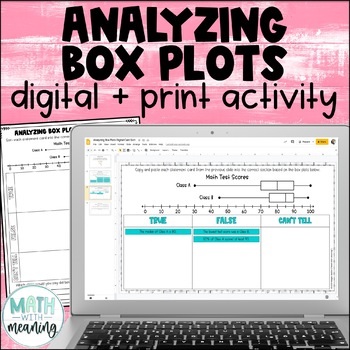
Box and Whisker Plot Digital and Print Card Sort - Reading and Analyzing
Looking for an engaging, no-prep activity to practice reading and analyzing box plots? Students will look at a double box plot and determine if statements about it are true, false, or if they can't tell from the information given in this fun digital and print activity.This activity includes statements about the minimum, maximum, median, quartile 1 (Q1), quartile 3 (Q3), interquartile range (IQR), and range of the box plots, along with statements about the percentages represented by a particular
Subjects:
Grades:
6th - 9th
Also included in: Middle School Math Digital and Print Activity Bundle Volume 3
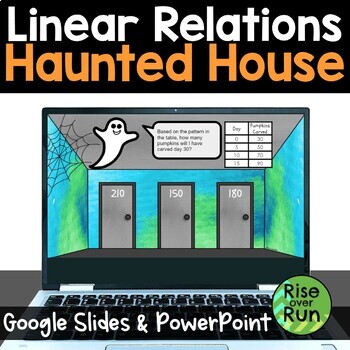
Digital Linear Relationships Halloween Escape Room Activity
Students will love this engaging practice activity for linear relationships. They must try to escape a haunted house! Includes Google Slides and PowerPoint versions. They are given 14 problems to solve, choosing from 3 possible answers for each one. If they solve correctly, they will choose the correct door and avoid the scary giant spiders! If they make a mistake, a spider appears, and they are prompted to try again. Problems include linear graphs, table of values, equations, and stories. Thi
Grades:
7th - 9th
Types:
CCSS:
Graphing BUNDLE
Graphing is an important part of connecting math, science, STEM, etc. This bundle of resources will help your students learn and practice the skills of deciphering which type of graph would work best for the data given and then how to properly create bar, line, and circle graphs.
This bundle (discounted at 20%) includes notes, practice pages, activities, and an interactive word wall. Please click on each product listed for further details or if you'd like to purchase them separately.

Slope Digital Math Escape Room Activity for Halloween
Students will love this fun practice activity for calculating slope between 2 points. Answering correctly will help them escape a haunted house! Includes Google Slides and PowerPoint versions. They are given 14 problems to solve, choosing from 3 possible answers for each one. If they solve correctly, they will choose the correct door and avoid the scary giant spiders! If they make a mistake, a spider appears, and they are prompted to try again. For each problem, students are given two ordere
Grades:
7th - 9th
Types:
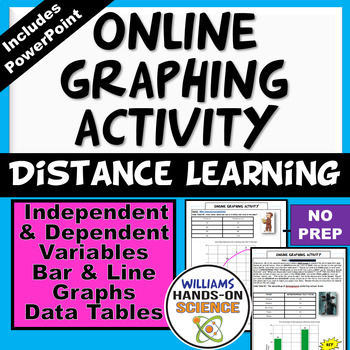
Distance Learning NGSS Online Graphing Activities Google Print Or Digital
This product is a great way to introduce graphing! This product includes four data tables the students use to create graphs using a website and it includes very detailed directions, questions and a key. The website I provide also has tutorials on how to graph, how to choose between a line graph and a bar graph, the difference between Independent and Dependent Variables and lots more! The other great aspect of this computer lab is following directions. Kids tend to say, “I can’t figure it out?”,
Subjects:
Grades:
6th - 11th
Types:
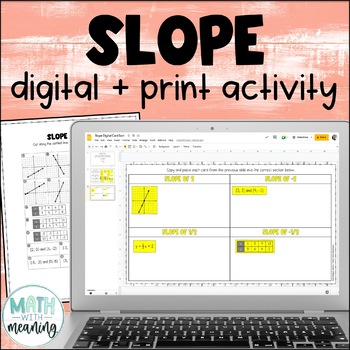
Finding Slope from Graphs, Tables, Equations, and Points Digital Card Sort
Looking for an engaging, no-prep activity to practice finding the slope when given a graph, equation, table, or two points? Students will sort 22 cards based on their slope in this fun digital and print card sort activity.Each problem gives either a table, a graph, two points, or an equation in slope-intercept form and asks students to find the slope. Please view the preview file to make sure that this resource is appropriate for your students.This product includes the following:A link to the ac
Grades:
6th - 9th
Also included in: Middle School Math Digital and Print Activity Bundle Volume 3

Comparing Linear, Exponential and Quadratic Functions (EQ2): HSF.LE.A.1...
Students will compare and contrast exponential functions with linear and quadratic functions by using these function types to model different scenarios. They will compare the values returned for each function in real-world contexts, the tables and graphs, as well as the general forms and the meaning of the constants in each form. This mission is aligned with Common Core State Standards: HSF.LE.A.1, HSF.LE.A.2.
The fun stuff:
What's the best bank account to keep your money in? Depends on if your
Subjects:
Grades:
7th - 10th
CCSS:
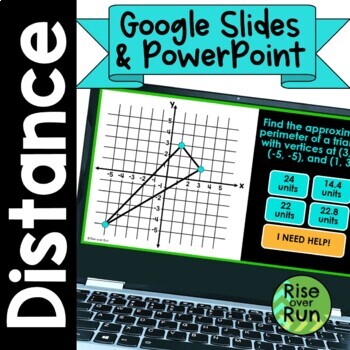
Distance Between 2 Points Practice PowerPoint & Google Slides
Students use the Pythagorean Theorem to find distances between points on a coordinate grid in this no-prep, self-checking activity. Four types of problems are included:Distance between 2 points on a graphDistance between 2 points sketched (for large numbers)Perimeter of polygons on a graphReal world map application problemsSolutions are in the format of whole numbers, decimals, roots, and rounded approximations. Problems range from very basic to challenging!16 problems are included. Each one is
Grades:
8th - 10th
Types:
Also included in: 8th Grade Geometry Unit Activities and Lessons

Virus Activity Reading Comprehension, Virus Worksheets and Graph, Microbiology
A packet of resources when teaching about the viruses and their interesting yet threatening characteristics. Lots of no-prep virus worksheets. The packet contains all of the resources below. Optimum for grades 6-9 science.Two informational texts, one on the general features of viruses and the other compares the coronavirus and rhinovirus and how they cause infections and colds. Both come with a multiple choice question sheet, answer key, and writing prompt worksheet. A one-page graphing activity
Subjects:
Grades:
6th - 9th
Also included in: Bacteria and Viruses Activity Packet, Worksheets, Microbiology Resources
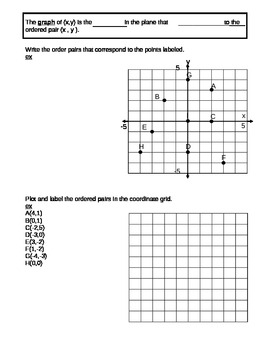
Coordinate Plane
This is a document that is used for guided notes for the Coordinate Plane. The notes practices how to plot points given ordered pairs, how to write the ordered pairs given the graph,and numbering the 4 quadrants.
Grades:
5th - 10th
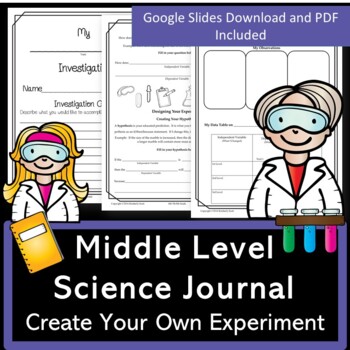
Science Experiment Journal Template | Digital Or Print | Grades 6 7 8
Are you looking to create hands-on investigations with your middle-level students? Help students think like a scientist using a lab report template. Included are an editable Google Slide document and a PDF version. We will take you step by step in designing unique experiments on the topic of your choice.A Google Slide version is included. We feel this journal is great to assign students to perform an experiment at home. During this time of digital learning, students can use supplies they have
Subjects:
Grades:
6th - 9th
Digital Mad Lib Math Activity - Identify Slope and Y-Intercept from a Graph
No prep. No paper. No materials. Totally digital. Great for Distance Education, 1:1, BYOD, or math computer centers. Google Drive, Google Classroom, and Microsoft One Drive.Students look at a graph and determine the slope and the y-intercept.This is an interactive, digital mad lib for math. Students work through 15 slides. Each slide consists of a problem and four possible choices. Students select their answers and then type them into the appropriate spaces on the last slide. The answers will cr
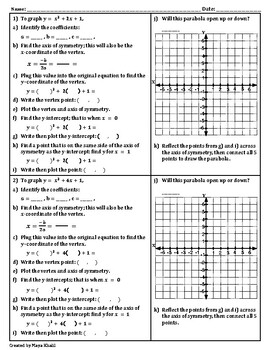
Graphing Quadratic Equations with the Axis of Symmetry & Vertex - Teach/Practice
Six problems for graphing quadratic equations by finding the axis of symmetry and vertex.The first problem or two could be used to teach the lesson.I have included two different versions in this resource: the first one presents the problems in a step-by-step format that guides students through the process of finding needed points to graph the parabolas.The second version provides the same problems without the step-by-step format; that, will be up to students.The preview above shows the entire re
Grades:
8th - 10th
CCSS:
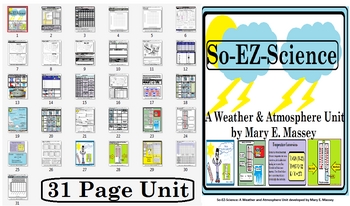
So-EZ-Science: Weather & Atmosphere Unit
This unit is a balanced literacy unit covering areas such as: temperature conversion, making a rain guage, recording weather, using weather station symbols, using the Beaufort Wind Scale, fronts, cloud types, cloud cover, graphing precipitation, graphing temperature, graphing weather phenomenon, weather tools, relative humidity, calculating relative humidity, precipitation, interpreting weather symbols on a weather map, reading a weather map, wind velocity, wind direction, wind speed, reading a
Subjects:
Grades:
3rd - 12th, Higher Education, Adult Education, Staff
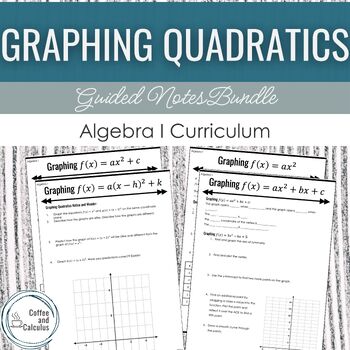
Graphing Quadratic Functions No Prep Guided Lesson Notes Bundle
Get ready-to-use (print and go) guided notes lesson plans for your middle school or high school Pre-Algebra or Algebra I course. These reference notes are great for initial instruction or for reviewing for state testing.This Bundle Features the following: Graphing Quadratics with a Vertical Stretch, Dilation, or ReflectionGraphing Quadratics with a Vertical Shift or TranslationGraphing Quadratics from the Standard FormGraphing Quadratics from the Vertex FormGraphing Quadratics with Intercept For
Grades:
8th - 10th
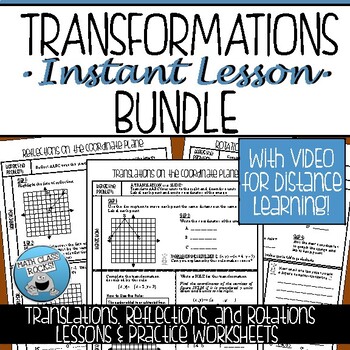
TRANSFORMATIONS GUIDED NOTES AND PRACTICE BUNDLE
Save time and make your life easy with this BUNDLE of Common-Core aligned TRANSFORMATIONS GUIDED NOTES and PRACTICE WORKSHEETS! Perfect for introducing new concepts, reviewing previously learned skills, or using in your interactive notebook. These step-by-step guided notes will simplify every lesson and provide a year-long resource for your students to refer to again and again!WHAT'S INCLUDED? 4 COMPLETE INSTANT LESSONS: TRANSLATIONS, REFLECTIONS, ROTATIONS, DILATIONSEACH lesson contains t
Grades:
7th - 9th
MATH GRAPHS & DATA Introduction to Various Graph Types PowerPoint PPT
This is a 36-slide PowerPoint presentation that provides the following information:
1. graphing vocabulary (data, scale, axis, interval, range, outlier);
2. definitions of and examples of 8 types of graphs (bar graph, double bar graph, line graph, line plot, stem-and-leaf plot, circle (pie) graph, pictograph, and histogram); and
3. a practice slide (with an answer slide to follow) for each type of graph.
Enjoy!
Deanne Davis, MCPSS
Subjects:
Grades:
3rd - 9th
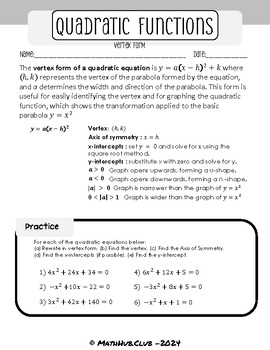
Intermediate Algebra Standard to Vertex Form + Key Elements Worksheet 1
Quadratic Equations: Standard to Vertex Form + Key Elements Worksheet 1Elevate your algebra curriculum with our comprehensive worksheet on quadratic equations, focusing on converting standard form to vertex form and identifying key elements. This resource, Worksheet 2 in the series, guides students through the process of finding the vertex, axis of symmetry, x-intercepts, and y-intercepts without encountering imaginary numbers.With practice problems that may require rationalizing the denominator
Subjects:
Grades:
12th, Higher Education
Showing 1-24 of 228 results


