15 results
Graphing unit plans for staff

Data Representation Powerpoint
The presentation contains: 1) TALLY MARKS Learning Objectives. Definition of a tally mark. Uses of tally mark. How to count a tally mark. Tally Mark Chart. Construction of a tally mark table with an example. Application on real life problems on tally mark. Read and Interpret a tally mark table.The presentation contains: 2) FREQUENCY DISTRIBUTION TABLEDefinition of a Frequency Distribution Table. Types of Frequency Distribution Table: a) Discrete Frequency Distribution Table (Ungrouped).b) C
Subjects:
Grades:
1st - 10th, Higher Education, Staff
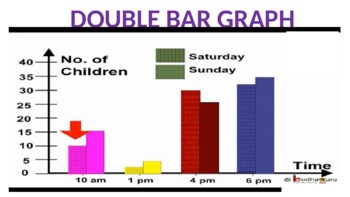
Double Bar Graph Powerpoint
The presentation contains:Learning Objectives.Definition of a double bar graph.Parts of a double bar graph.Difference between bar graph and double bar graph.Tips for construction of double bar graph.Steps to construct double bar graph with an example.To read and interpret the double bar graph.
Subjects:
Grades:
5th - 10th, Staff
Also included in: Data Representation Powerpoint

Pie Chart Powerpoint
The presentation contains:Learning Objectives.Definition of a Pie Chart.Tips for construction of pie chart.Steps to construct a pie chart with an example.Scaling and drawing a pie chart.Read and Interpret a pie chart.
Subjects:
Grades:
5th - 10th, Staff
Also included in: Data Representation Powerpoint
Line Graph Powerpoint
The presentation contains:Learning objectives.Definition of a line graph.Parts of a line graph.Tips for construction of line graph.Steps to construct line graph with an example.Reading and Interpreting a line graph.Advantage of line graph.
Subjects:
Grades:
5th - 10th, Staff
Also included in: Data Representation Powerpoint
Data/Graphing
This is a 5-7 day unit that teaches data collection, bar graphs, line graphs, line plots, mean, median, and mode. This unit includes lesson plans, all needed materials, assessments, homework assignments, and more. Posters for lesson objectives are included, and this aligns to the common core. Students will be responsible for knowing important vocabulary, they will learn to read different graphs, and they will be creating their own graphs from data they collect, or a set of data that is given.
Grades:
2nd - 4th, Staff
Types:
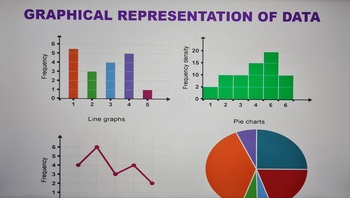
Graphical Representation of Data Powerpoint
The presentation contains the follows:1) BAR GRAPH Learning objectives. Definition of a bar graph. Parts of a bar graph. Tips for construction of bar graph. Steps to construct bar graph with an example. Types of bar graph. Advantages of bar graph. 2) DOUBLE BAR GRAPH Learning Objectives. Definition of a double bar graph. Parts of a double bar graph. Difference between bar graph and double bar graph. Tips for construction of double bar graph. Steps to construct double bar graph wit
Subjects:
Grades:
5th - 9th, Staff
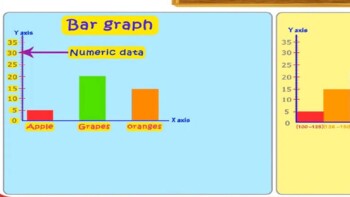
Bar Graph Powerpoint
The presentation contains:Learning objectives.Definition of a bar graph.Parts of a bar graph.Tips for construction of bar graph.Steps to construct bar graph with an example.Types of bar graph.Advantages of bar graph.
Subjects:
Grades:
6th - 9th, Higher Education, Staff
Also included in: Data Representation Powerpoint
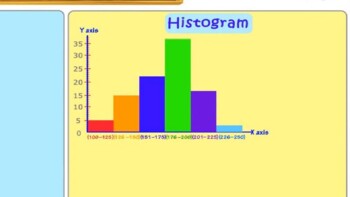
Histogram Powerpoint
The presentation contains:Learning Objectives.Definition of a Histogram.Parts of a histogram.Difference Between bar graph and histogram.Types of intervals.Tips for construction of bar graph.Steps to construct bar graph with an example.Read and Interpret a histogram.
Subjects:
Grades:
7th - 11th, Staff
Also included in: Data Representation Powerpoint
Introduction to Graphs Powerpoint
The presentation contains:Real life application.Mathematician behind the Cartesian system .Ordered pair with examples.Coordinate Planes.Quadrants.The signs of each of the Quadrant with examples.Way of locating points on a graph paper.
Subjects:
Grades:
7th - 10th, Staff
Frequency Distribution Table Powerpoint
Objective: The student will be able to organize the given data to a meaningful and understandable.The presentation contains:Definition of a Frequency Distribution Table. Types of Frequency Distribution Table: a) Discrete Frequency Distribution Table (Ungrouped).b) Continuous Frequency Distribution Table (Grouped). Uses of Frequency Distribution Data.5 steps to construct a Frequency Distribution Table with one example on ungrouped data and two examples on grouped data.Steps include how to
Subjects:
Grades:
5th - 8th, Staff
Also included in: Data Representation Powerpoint
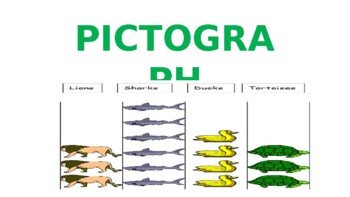
Pictograph Powerpoint
The presentation contains:Learning Objectives.Definition of a Pictograph.Parts of a pictograph.Tips for construction of pictograph.Steps to construct pictograph with an example.Scaling and drawing a pictograph.Read and Interpret a pictograph.
Subjects:
Grades:
1st - 7th, Staff
Also included in: Data Representation Powerpoint
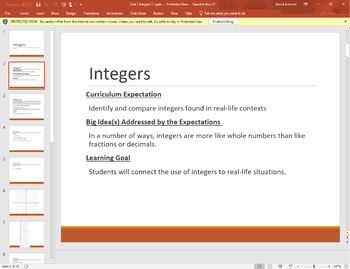
Number Sense and Numeration- Integers
8 PowerPoint lessons outlining the following curriculum expectations:Identify and compare integers found in real-life contexts (Lesson 1)Represent, compare and order integers (Lesson 2)Represent the zero pairs using integer tiles and understand zero principle (Lesson 3)Add and subtract integers, using a variety of tools (Lesson 4)Be able to subtract integers using integer tiles. (Lesson 5)Add and subtract integers, using a variety of tools (Lesson 6)Add and subtract integers, using a variety of
Subjects:
Grades:
7th, Staff
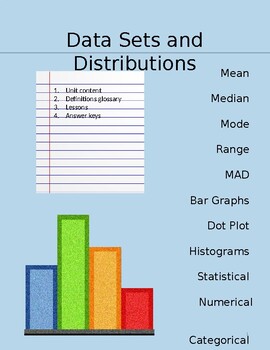
Data Set and Distribution Unit packet NO PREP (6th grade) Distance Learning
This Unit packet has it all ( 16 Lessons with answer keys and a glossary) and requires NO PREP. This packet is designed to meet Common Core Standards for 6th grade math.
Subjects:
Grades:
5th - 7th, Staff
Types:
The Graphs of Trigonometric functions
In this e-book, the graphs of sine, cosine, tangent, cosecant, secant and cotangent functions are given and discussed.
In particular, we discuss:
1. The domain
2. The range
3. The period
4. The x-intercept(s)
5. The y-intercept
6. The vertical asymptote
Subjects:
Grades:
9th - 12th, Higher Education, Adult Education, Staff
Types:
Showing 1-15 of 15 results


