77 results
Free school psychology resources for Microsoft Excel
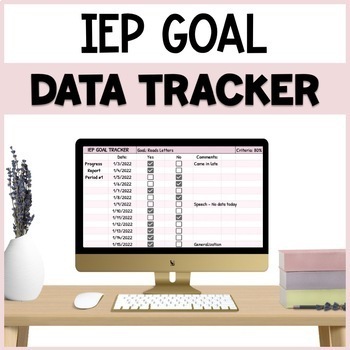
IEP Goal Data Tracker Digital Free - Google Sheet™ Data Collection Sheet
If you are tracking IEP Goal and Objective data in your classroom, this resource is for you! This Google Sheets template is a perfect progress monitoring tool for any special education classroom.Each template includes space for:The goal name (e.g., "Reads Letters")The criteria (e.g., 80% accuracy over 3 consecutive opportunities)Checkboxes to indicate daily performance "Yes" or "No" based on the learner's scored performance of the goalThere are five templates in varied color schemes. Duplicate f
Grades:
Not Grade Specific
Types:
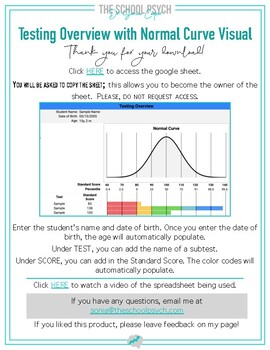
Google Sheet Bell Curve Interactive Visual
This is a Google Sheet that you can visualize standard scores on the normal curve. You will receive access to a spreadsheet with TWO tabs. One tab is for a Standard Deviation of 15, and the other tab is for a Standard Deviation of 10.All you need to do is: Enter the student's nameEnter the student's date of birth (the age will automatically populate!) Enter the subtests that you are reporting out onEnter the standard scores for each subtestAfter purchasing, you will be asked to download a PDF
Grades:
Not Grade Specific
Types:
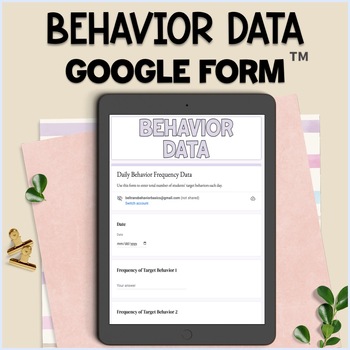
Behavior Data Tracker Google Form™
If you use behavior data trackers for your students or teach in a classroom with students with Behavior Plans, this resource is for you! This is perfect for any autism, ABA, or other special education classroom setting!You are receiving a Google™ Folder with 2 items:1- An editable Google Form™ set up to collect daily behavior (frequency count) data for up to three behaviors.2- A Google Sheet™ that will track the received responses from the Form and input them into a graph that has already been s
Grades:
Not Grade Specific
Types:
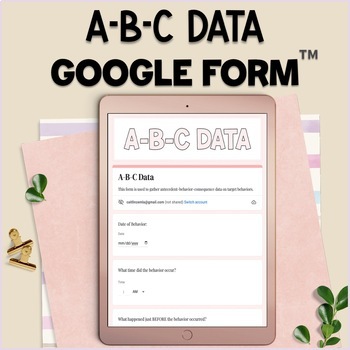
ABC Data Google Form™ | Behavior Data Tracker
If you use behavior data trackers for your students or teach a special education classroom with students with Behavior Plans, this resource is for you! This Google Form™ tracks Antecedent Behavior and Consequence (ABC) Data for your students behaviors.This is a Google Form™ set up with preloaded questions for:Date and time of behavior incidentWhat happened right before the behavior (with multiple checkbox options listed)What type of behavior occurred (disruption, noncompliance, etc.)What happene
Grades:
Not Grade Specific
Types:
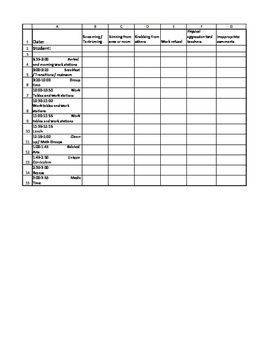
Classroom Behavior Tracking Log Sheet (Editable)
I find this log sheet helpful when tracking a student's behaviors in my classroom. It is helpful to see when the most frequent behaviors and the times they are occurring the most. This is a great help when working on a functional behavior assessment. I use tally marks to mark each time the behavior occurs during the time period / subject. After the target behaviors have been determined, I log for period of time (daily for 2-4 weeks), I log all of the days in a chart to see if the behaviors o
Grades:
Not Grade Specific
Types:
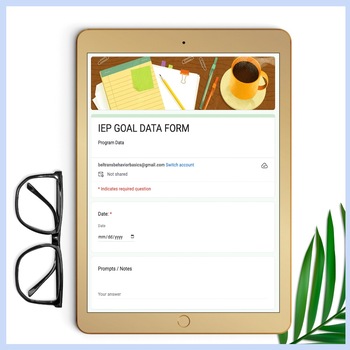
IEP Data Collection Tracker Google Form™
If you struggle with IEP data collection in your classroom, this resource is for you! This Google Form™ skill data tracker perfect for any autism, ABA, or other special education classroom setting!You are downloading a Folder with 2 items:An editable Google Form™ set up to collect percentage data for up to five IEP goals.A Google Sheet™ that will track the received responses from the Form and input them into a pre-made graph so that you can visually monitor progress!When you click the spreadshee
Grades:
Not Grade Specific
Types:
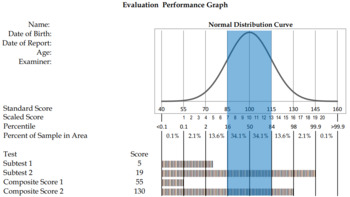
Standard/Scaled Score Bar Graph Under Highlighted Bell Curve Excel File
This Excel file displays a bar graph under a Highlighted Bell Curve when scores are entered. It can be used to show explain scaled and standard scores.
Grades:
Not Grade Specific
Special Education Evaluation Due Date Calculator
Tired of counting the days on your calendar to determine when a child is due for their evaluation? Let me do the work for you. Simply add in your days off to this excel spreadsheet and make a tedious task an easy one!Note: the product default is 30 school days, but it is customizable!
Grades:
Not Grade Specific
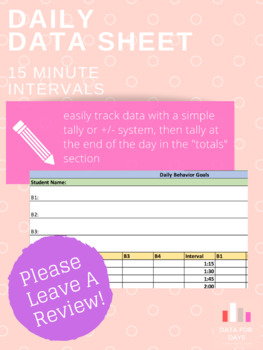
Daily Data Sheet (15 minute intervals)
With the Daily Data Sheet you can keep all of you students behavior/academic goals in one place throughout the day! Data sheets are often difficult to create and can be timely for teachers. This daily data sheet will make your data tracking effortless and easily integrated. The data sheet is double-sided and broken down into 15 minute intervals with an area for "additional notes" as well as behavioral goal references. Data is made easy as you either tally occurrences of behavior or simply use +
Grades:
Not Grade Specific
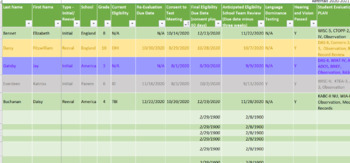
Referrals List Assessment/Evaluation Tracker
As a School Psychologist, it can be difficult to organize the testing process and keep up with timelines. This spreadsheet helps in keeping track of all major aspects of the assessment process. Once the consent to test is obtained, additional columns automatically update to show when the 60-day timeline is up, as well as three weeks prior to the deadline - when a report might be expected to be due for completion. Conditional formatting is applied to the last few columns, changing the color of ro
Grades:
Staff
Types:

IEPs At-a-Glance - Full Class Profile Chart
This Google Sheet is a fully customizable and editable way to present students' IEP information at a glance. This "catch all" chart makes it easy to share pertinent information with related service professionals, general education teachers, administrators, and more!
Grades:
Not Grade Specific
Types:
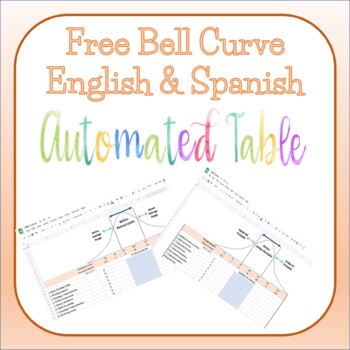
Bell Curve Eng. & Span
Hi, here is a bell curve both in English & Spanish.-You can edit the areas assessed and it automatically translates it to Spanish on the other bell.-When you enter the standard score it automatically plots it and it enters it on the Spanish bell too.Tip: you can download to excel and copy-paste to your report. When you copy and paste it to your word document "paste as a picture"... for some reason this works better than google sheets.Here is a link to the video so that you can see how the ta
Grades:
PreK - 12th, Higher Education, Adult Education, Staff
Replacement Behavior Data Sheet - Editable
Download this free data sheet to monitor replacement behaviors. This form can be given to staff to document frequency of target behaviors.For quick analysis and digital administration, see bundle at a discounted priceReplacement Behavior BundleFollow me on TpT for freebies, updates and new material!
Grades:
Not Grade Specific
Types:
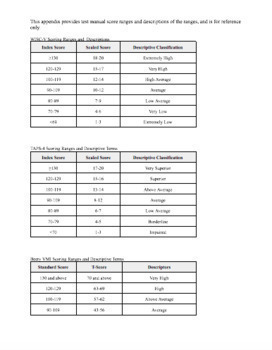
Descriptive/Classification Tables from Testing Manuals
This product is designed to make report writing more efficient by providing the descriptive/ classification tables in an easy to read format and all in one document. These tables can be copied and pasted to be included in your psycho-educational reports. They can be embedded into your report or added to your appendix page for readers to reference.Classication/ Descriptive Tables included:WISC-VDAS-2WRAML-3BASC-3CDI-2CTOPP-2TAPS-4Conners-3Beery VMIMASC-2NEPSY-2WJ-IV CognitiveBateria IVUNIT2Leite
Grades:
Not Grade Specific
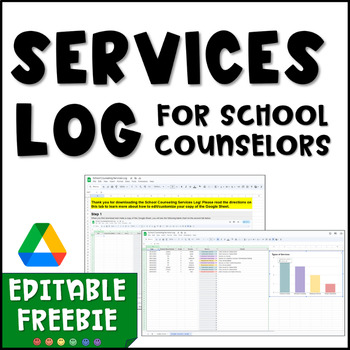
School Counseling Services Log (Digital)
Documenting the services we provide as school counselors is important, and having this data readily available is even more helpful! Use this digital services log to instantly track your student meetings, counseling lessons, and more. Then, share this aggregated data with stakeholders as a way of advocating for your role and use of time.Step-by-step directions with visuals are included in the sheet on how to customize this services log to best meet your needs. This sheet could also be adapted and
Grades:
Staff

Automated Psychoeducational Report **FREE SAMPLE**
If you are wanting to experience an Automated Psychoeducational Report first-hand, then this is a great option for you! I encourage you to time yourself when you write-up one of the tests included (WISC-V).If you like the sample, then check out the full Automated Psychoeducational Report! Within the description are Youtube Tutorials as well:https://www.teacherspayteachers.com/Product/Automated-Psychoeducational-Report-5818692
Grades:
Not Grade Specific
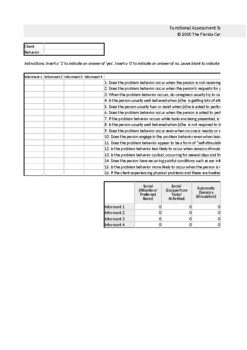
Functional Assessment Screening Tool (FAST)
The Functional Assessment Screening Tool (FAST) is an indirect assessment tool utilized to identify hypothesized sources of reinforcement for challenging behavior. This tool is widely used in the field of Applied Behavior Analysis (ABA). Download this resource for an editable excel file that auto-populates responses to the 16 item questionnaire and creates a corresponding graph with the results from your assessment.
Grades:
Staff
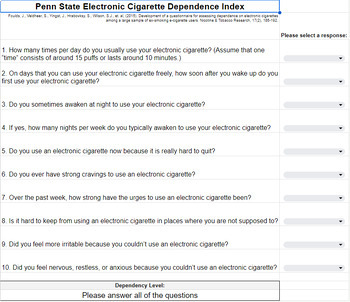
Vaping FBA
This free resource contains two scales which are freely available on the internet, I have just gathered together, cited the sources, and formatted them into a self-scoring google sheet. The first is a 10-question chemical dependency assessment for vapes. After all 10 questions have been answered, a dependency level is noted.The second is adapted from the FASTR for functions of smoking, where the questions have been adapted to vape usage. After all of the questions are answered, each function whi
Grades:
Not Grade Specific
Types:
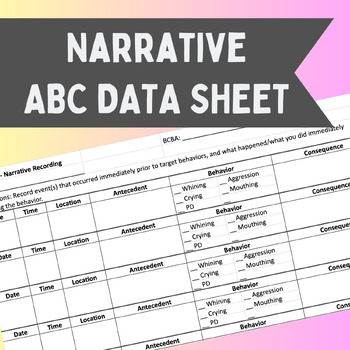
Narrative ABC Data Sheet
A simple and brief data sheet to be printed for narrative ABC data collection. The data sheet is fully customizable and you can add up to 6 target behaviors. I recommend adding behavior definitions below the data collection area and printing those on the backside of the data sheet.
Grades:
Staff
Types:
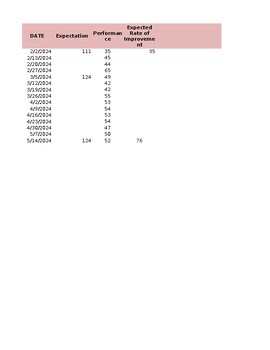
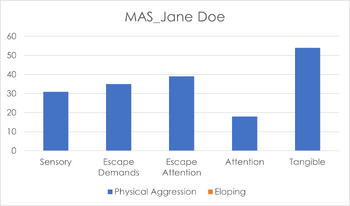
Motivation Assessment Scale 2.0-Pre-Formatted Graphs for FBA
The Motivation Assessment Scale (MAS) pre-formatted graphs provide a visual representation of motivation assessments for specific target behaviors. These user-friendly graphs allow for efficient data entry, automatic score calculations, and clear visualization of the motivation levels as assessed by different raters. By utilizing these pre-formatted graphs, users can easily analyze and interpret motivation data, facilitating evidence-based decision-making in behavior intervention planning and su
Grades:
Not Grade Specific
Types:
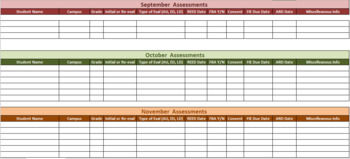
Electronic Testing Log
I have successfully used this testing log for the last two years. At the beginning of the year, you go through your campus list and put all of the re-evals in their respective months, based on due date. This will allow you to see how busy your year will be, and bump up evaluations when needed. As Initials and Special Requests come up, you put them in the months when they are due. This at-a-glance worksheet is so helpful in planning, and I keep it open at all times. If you store it in your Google
Grades:
Not Grade Specific
Types:
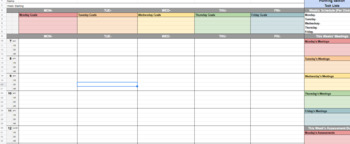
Daily Excel Planner: Counselors, School Psychologists, Behavior Specialists
This Daily Excel Planner is a great organizational resource for Counselors, School Psychologists, Behavior Specialists, and educators to plan and track their daily activities.
Grades:
Not Grade Specific
Types:
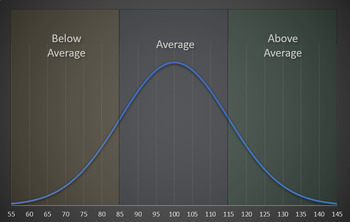
Graph of Bell Curve with Normative Ranges
A graph with a bell curve and normative ranges (below average, average, and above average) created with Microsoft Excel. This may be potentially useful for any ESAs who present standardized assessment results to families.I present this image in evaluation feedback meetings as a simple way to introduce how to interpret standard scores. I then use my graph template (see my product page) to automatically plot test names and scores onto this graph in an easily readable format. I have found that this
Grades:
Not Grade Specific
Types:
Showing 1-24 of 77 results

