16 results
Instructional technology Common Core 5.MD.B.2 resources
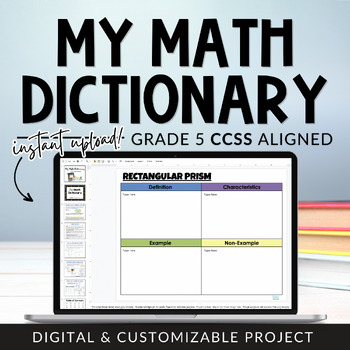
Grade 5 CCSS Math Dictionary Digital Resource Year-Long Math Vocabulary Project
Math vocabulary words not sticking? Need a system to help students learn and retain math vocabulary? How about a simple, easy-to-use system that goes beyond just memorization, is fun and engaging, creates student ownership, and is 100% paperless? Yes Please! My Math Dictionary is a year-long digital math vocabulary project created for Google Slides.As new or unfamiliar math vocabulary words are encountered throughout the school year, students complete the Frayer Model vocabulary templates which
Subjects:
Grades:
5th
Types:
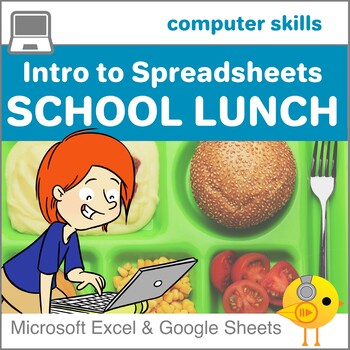
Spreadsheets and Graphing for Beginners - School Lunch
A Great Activity for Beginners!Enhance your students' developing knowledge of spreadsheets with this high interest activity. Students will key data from a poll of favorite school cafeteria menu items, create two simple formulas and create a simple column chart.Included are:*Teacher lesson plan with ISTE and Common Core objectives aligned;*Attractive 2 page set of questions and directions for students;*Answer key***************************************************************************More Spre
Grades:
3rd - 6th
Types:
Also included in: Custom Bundle for Cheryl C.
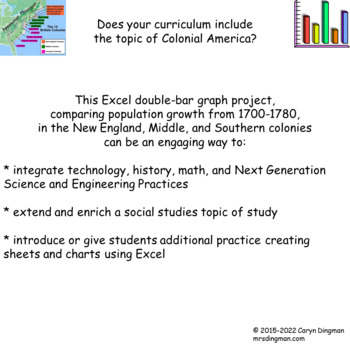
Excel Graphing 13 Colonies Population Growth with Digital Student Directions
Does your curriculum include a study of Colonial America? This Excel double-bar graph project, comparing population growth from 1700-1780, in the New England, Middle, and Southern colonies, can be an engaging way to:* integrate technology, history, math, and Next Generation Science and Engineering Practices* extend and enrich a Social Studies unit of study* introduce or practice having students create sheets and charts using ExcelProject file includes:* teacher notes/ classroom management sugges
Grades:
4th - 6th
Excel Graphing M & M Candy with Digital Student Directions
Excel-lent spring or end of year project! This classroom-tested activity can be a perfect way to re-engage your students before or after state testing!Students will sort and count M & M candies, each using Excel to create a bar graph displaying/comparing the colors found in each individual small bag of M & M's. Each student will search and insert clipart or name-brand images of each candy color into each bar of his/her graph.Project file includes:* teacher notes/ classroom management sug
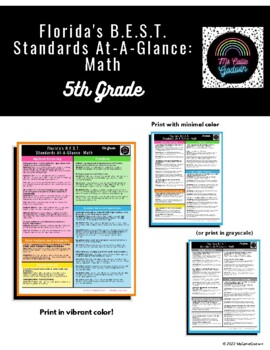
Florida's B.E.S.T. Standards At-A-Glance: Math - 5th Grade
Thank you for your interest in our resources!The Florida's B.E.S.T. Standards At-A-Glance: Math - 5th Grade print out is a one-page (if printed double-sided), color coordinated document utilized for quick-referencing when curriculum mapping, lesson planning, and more! There are two different versions- one that can be printed in color and another with minimal color that can even be printed in grayscale. The download is featured as a PDF that can also be added to your digital planner- making plann
Grades:
5th
Excel Graphing $1000 Simulated Shopping Spree
Does your curriculum include a study of fractions?This classroom-tested $1000 Simulated Shopping Spree Excel circle, or pie graph project can be an engaging way to:* give students a chance to make real-world connections practicing estimating * interpret fractional parts of a whole in a way that's personal and unique* integrate technology and math* introduce, extend, or enrich a math topic of study* introduce or practice creating sheets and charts using ExcelThis classroom-tested project file in
Subjects:
Grades:
4th - 6th
Types:
Excel Graphing Halloween Trick-or-Treat
Homework?? On Halloween?? Seriously??!!This Halloween Trick-or-Treat Excel Project, updated July 2018, can be an engaging way to:* integrate technology* introduce, extend, or enrich a math topic of study* introduce students to creating sheets and charts using Excel* give students a chance to graph their Halloween goodies collected in a way that’s real and relevant! This classroom-tested Halloween Excel project file includes: * student project directions sheet, in checklist form * rubric to score
Subjects:
Grades:
3rd - 6th
Types:
Excel Graphing Classroom Birthdays with Digital Student Directions
Give your students a chance to get to know their classmates, comparing their birthday celebration data in a way that's real and relevant!This Class Birthdays Excel Project can be an engaging way to:* integrate technology* introduce, extend, or enrich a math topic of study* introduce students to creating sheets and charts using ExcelThe classroom-tested product file includes:* class survey, using Google Forms, to find out the month in which each student celebrates a birthday* student project dire
Grades:
3rd - 5th
Types:
Excel Graphing Easter Fruit Snacks with Digital Student Directions
How About a Little Excel-lent Graphing to Add to Your Digital Learning Resources?Let’s Go Paperless!This digital, paperless Easter Fruit Snacks Data Collection and Excel Graphing Activitycan be an engaging way to:* integrate math, technology, and Next Generation Science and Engineering Practices* extend and enrich a math topic of study* introduce or give students additional practice creating sheets and charts using Excel* give students a real, personal, and unique way to compare data that’s fun
Excel Graphing Planet Weights with Digital Student Directions
Does your curriculum include a study of the solar system and/or forces and motion?Want to give your students a real-world and personal way to practice decimal multiplication?This Planet Weights Excel Project can be an engaging way to:* integrate technology, math, and Next Generation Science and Engineering Practices* introduce, extend, or enrich a math and science topic of study* introduce or practice creating sheets and charts using Excel* give students a chance to make connections across the c
Subjects:
Grades:
3rd - 6th
Types:
NGSS:
5-ESS1-2
, MS-PS2-4
Valentine Candy Hearts Google Sheets Graphing with Digital Student Directions
How About a Google Sheets Graphing Activity to Add to Your Digital Learning Resources?This digital, paperless Valentine Candy Hearts Data Collection and Google Sheets Graphing Activity can be an engaging way to:* integrate math, technology, and Next Generation Science and Engineering Practices* extend and enrich a math topic of study* introduce or give students additional practice creating sheets and charts using Google Sheets* give students a real, personal, and unique way to compare data that’
Grades:
3rd - 6th
Excel Graphing Temperature Comparison
What's the temperature like in YOUR town? Does your curriculum include a study of weather factors? This Temperature Comparison Excel double-bar graph project can be an engagingway to:* integrate technology, math, science, and geography* introduce, extend, or enrich a math, social studies, or science topic of study* introduce or practice creating sheets and charts using Excel* give students a chance to make connections across the content areasThis classroom-tested project file includes: * student
Grades:
4th - 6th
Types:
NGSS:
5-ESS1-2
, 3-ESS2-1
, 3-ESS2-2
, 5-ESS2-1
, MS-ESS2-6
...
Excel Graphing Lucky Charms Marshmallows
Give your students a real-world chance to compare Lucky Charms cereal marshmallow data in a way that's personal and unique!This Lucky Charms Marshmallows Excel Project can be an engaging way to:* integrate technology* introduce, extend, or enrich a math topic of study* introduce or give students additional practice creating sheets and charts using Excel The classroom-tested product file includes:* student project directions sheet, in checklist form* rubric to score each completed graph* sample b
Grades:
3rd - 6th
Excel Graphing Pulse Rate Comparison
Does your curriculum include a study of the circulatory system? This Pulse Comparison Excel double-bar graph project can be an engaging way to:* integrate technology, math, and science* introduce, extend, or enrich a math or science topic of study* introduce or practice creating sheets and charts using Excel* give students a chance to make connections across the content areasStudents will be encouraged to wonder… Would the time of day and what we were doing affect our pulse rates?Pulses will be
Excel Graphing Valentine Conversation Hearts
Explore Excel circle graphing with a Valentine's Day project that's fun and delicious!Students will create circle, or pie graphs using Excel to display Valentine candy hearts' data. Fractional parts of a whole will be reviewed and discussed as part of the project. Project file includes sample bulletin board display poster, project directions in individual student checklist form, and rubric to grade the finished graph.Project file student directions have been updated for Excel 2016.This project w
Grades:
3rd - 6th
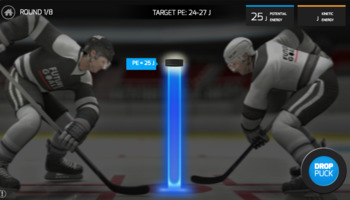
STEM Digital Resource for Grades 4-8
Future Goals - Hockey Scholar - Digital Simulations to Explore STEM - http://bit.ly/2zs0V5L
*2017-2018 Update - Now Available in Math and Science Editions*
Future Goals - Hockey Scholar™ brings science, technology, engineering, and math (STEM) concepts to life using the exciting, fast-paced game of hockey. Through immersive real-life simulations, students build their understanding of fundamental STEM concepts, such as geometric constructions, energy, and forces. In Hockey Scholar, each module
Subjects:
Grades:
4th - 8th
Types:
Showing 1-16 of 16 results

