94 results
Statistics Common Core 5.MD.B.2 resources
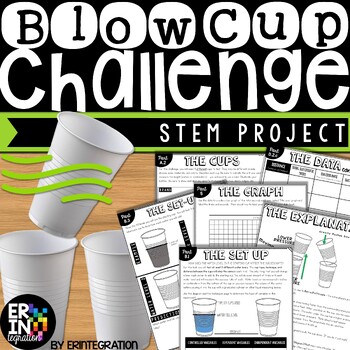
Blow Cup STEM Challenge and Scientific Method Project
The Blow Cup Challenge is now a STEM activity with this engaging science project inspired by the viral video where students try to blow one cup into another cup. Great low-prep way to teach the scientific method, variables and review math skills!This self-paced, multi-part Blow Cup STEM challenge is print-and-go. Each activity sheet guides students through the project. STEM Challenge Overview:Students will use the included visual directions, graphic organizers, charts, and activities to...Deter
Subjects:
Grades:
3rd - 6th
Types:
NGSS:
MS-PS2-2
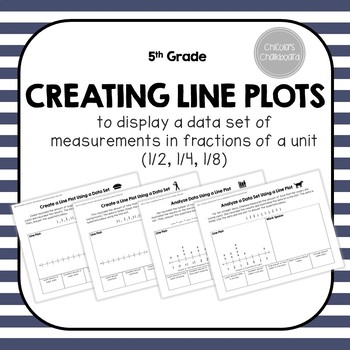
Line Plots with Fractions - Data Sets with Student Reference Sheet
Using this activity, students will be able to analyze data sets by using line plots. They will find the following: minimum, maximum, total amount, range, average, and most common. They will also create the line plots using the data provided.
This set includes:
-Table of Contents and Common Core State Standards
-Two Reference Sheets (Key Terms and How to Create Line Plot)
-Four Different Data Worksheets
1. One data sheet that includes a completed line plot
2. One data sheet that
Subjects:
Grades:
5th
Types:
CCSS:
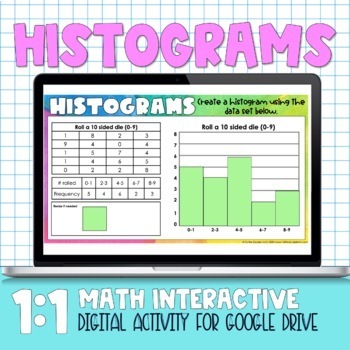
Histograms Digital Practice Activity
Histograms Digital Practice ActivityThis product is a Google Slides product- students can complete it digitally. Included in this product: -4 different histogram problems- students have to drag and drop to create histogram plots-4 page printable version-Answer KeysCheck out my other Distance Learning Digital Products Here
Subjects:
Grades:
6th - 7th
Also included in: Statistics Digital Activities
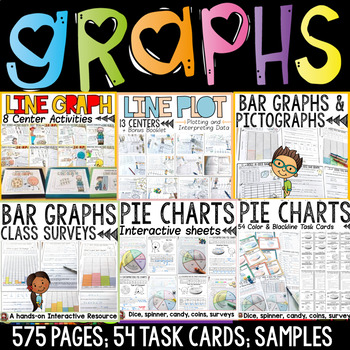
Bar Graphs Pictographs Line Graphs Line Plots Pie Charts Data Collection Bundle
The graphing bundle features interactive activities for creating and interpreting bar graphs, pictographs, line graphs, line plots and pie charts. Your entire graphing unit for a year!Separate folders featuring both British English and US spellings and terminology included.Great quality and value for this whopping 575 + page unit on graphing! Data is collected and interpreted using concrete materials such as visuals, dice, spinners, coins and other real-life objects and contexts. Further details
Subjects:
Grades:
2nd - 6th
Types:
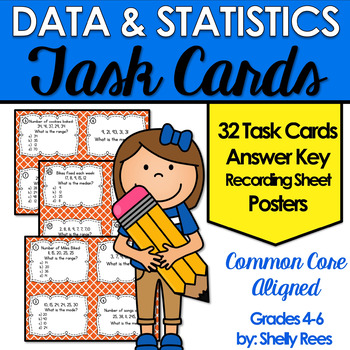
Mean, Median, Mode, Range Task Card and Poster Set - Data and Statistics
Mean, Median, Mode, Range, Data and Statistics is easier for students to master with this easy-to-use set of task cards and posters! Students will love the variety of practice with this task card set, and teachers will enjoy the little prep with big results!
Click here and SAVE by buying the Complete Bundle of Math Task Cards for Grades 4-6.
This helpful Data and Statistics Task Card Set includes:
• 32 Task Cards (28 on-level and 4 challenge)
• 5 Example and Teaching Posters
• 2 Standard Pos
Subjects:
Grades:
4th - 7th
Types:
CCSS:
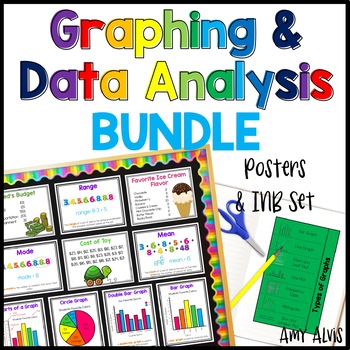
Graphing and Data Analysis Bundle Posters Interactive Notebook INB Anchor Chart
This bundle includes my Graphing Poster and Interactive Notebook (INB) set, my Data Analysis Poster and Interactive Notebook (INB) set and my Data Posters and Cards. Make sure to check the links below to see what comes with each set.This bundle includes:1. My best selling Graphing - Poster and INB Set.This poster and interactive notebook (INB) set includes FOURTEEN posters covering bar graphs, double bar graph, pictographs, picture graph, line graphs, double line graph, line plot, circle graphs
Subjects:
Grades:
2nd - 6th

Line Plots Whodunnit Activity - Printable & Digital Game Options
Nothing like a good criminal investigation to liven up line plots! Based off my popular CSI projects, I have created Whodunnits? The Whodunnits plan to focus on single content topics as opposed to units and will focus more on skill building than application. Every day can't be a project day, so Whodunnits can be an engaging out of their seat activity to practice important skills. In a Whodunnit?, students will work in teams to solve 10 practice problems that increase in difficult. After each ans
Subjects:
Grades:
4th - 9th
Types:
Also included in: Pre-Algebra Whodunnit Activity Bundle - Printable & Digital Game Options
5th Grade Data and Line Plots, 30 Enrichment Projects and 30 Test-Prep Problems
No-prep, 5th grade line plots and data math practice with 30 enrichment projects and 30 review test-prep questions aligned to the 5th grade math standards. A great way to teach the data standards in a fun, engaging way. Perfect for early finishers, advanced math students or whole class practice. Print and go math enrichment! These work perfectly for distance learning as well.This resource is aligned to the 5th grade math CCSS standards: 5.MD.B.2. (However, this resource is perfectly suitable t
Subjects:
Grades:
5th
Types:
CCSS:
Also included in: 5th Grade Math Projects For Every Standard! Enrichment All-Year Bundle!
CSI: Representing Data Activity - Printable & Digital Review Game
Nothing like a good criminal investigation to liven up data analysis! In this project, students will work in teams to investigate the culprit of six fictional thefts. The criminal has left six messages, layered with practice. Teams will work to build a case and present their findings to the court. Hopefully they are convincing enough to win the verdict.This is a elementary unit with a puzzle solving hook causes many different students to engage in solving traditionally mundane problems. 4th and
Subjects:
Grades:
3rd - 6th
Types:
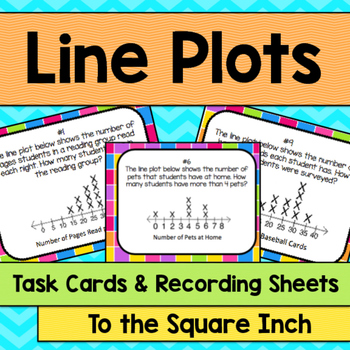
Line Plot Task Cards | Line Plot Math Center Practice Activity
Line Plot Task Cards and Record Sheets CCS: 4.MD.B.4, 5.MD.B.2, 6.SP.B.4Included in this product: *20 unique task cards dealing with reading and making line plots.*4 different recording sheets*Answer KeyCheck out addition statistics products HERE
Subjects:
Grades:
3rd - 6th
Types:
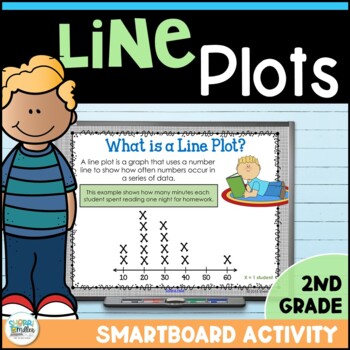
Line Plots Graphing Smartboard Digital Lesson & Student Booklet
Line plots can be a difficult concept for students. This Smartboard lesson and printable booklet will provide you and your students with several activities to practice creating line plots and answering questions about them. The student booklet will keep students engaged during the lesson! You must have Smart Notebook software to open this file. You may also be interested in these other resources:Measurement Digital Escape Room - Escape the Spaceship using Google Apps Geometry Angles Digital Es
Subjects:
Grades:
4th - 5th
Math Interactive Notebook 5th Grade Texas Standards 4
STAAR WORKBOOK:
STAAR MATH PREP WORKBOOK
The 5th Grade Interactive Notebook has journal entries, foldables, notes, and practice for Category 4
Texas Standards:
5.9A S
5.9B S
5.9C R
5.10A S
5.10B S
5.10E S N/A
5.10F S N/A
Still missing 2 TEKS (Standards) but will update soon. Get it while the bundle is on discount.
Your wonderful and positive feedback is greatly appreciated. I hope you enjoy these activities as much as my students have. The other categories and grade levels are coming very so
Subjects:
Grades:
5th
CCSS:
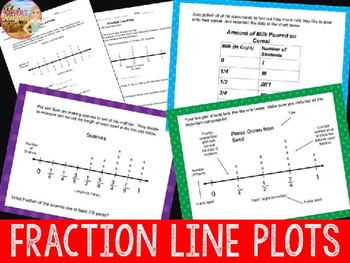
Fraction Line Plots Unit
Fraction Line Plots are easy to teach with this unit. Students will interpret line plots with addition and subtraction with these slides and accompanying worksheets.Students will evaluate ready-made fraction line plot data as well as learn how to make their own graphs from a given set of fraction data.Materials Included- Data Analysis Vocabulary Slide- 7 Interpreting Data Graphs (35 slides)- 3 Charts for Creating Graphs (10 slides)- 9 Student Sheets- Post-Test- Answer KeyNo-Prep SetupFor each se
Subjects:
Grades:
5th - 6th
CCSS:
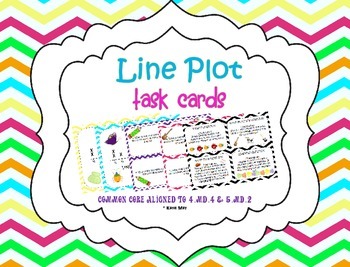
Line Plots Task Cards With Fractions ~CCSS 4.MD.4 & 5.MD.2
This colorful set of 5 completed line plot posters and 20 task cards is exactly what your students need to help them practice analyzing and interpreting data from line graphs. This product can also work well for differentiating activities for learners in 3rd or 6th grade.
This set includes:
5 Line Plot Posters
20 Task Cards (4 per line plot)
4 Challenge Task Cards
1 Answer Key
1 Student Worksheet
Use this set in a math center during math workshop, in a classroom game (such as SCOOT), as inde
Subjects:
Grades:
3rd - 6th
Types:
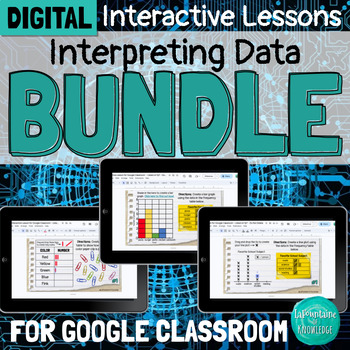
DIGITAL Interpreting Data Interactive Lesson Bundle for Google Classroom
This bundle of 3 digital interactive math lessons for Google Classroom teaches interpreting categorical and numerical data using frequency tables, bar graphs, and line plots. Each lesson includes: a video lesson (YouTube and Loom viewing options included) practice problems and activitiesteacher directions and answer keysThese lessons are ready to assign and easy for students to complete independently. Students will learn:important vocabulary - title, categories, tally marks, key, categorical dat
Subjects:
Grades:
3rd - 5th
Types:
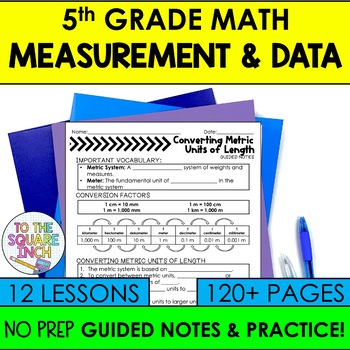
5th Grade Measurement and Data Guided Notes | Volume, Unit Conversion, 3D Shapes
Looking for 5th grade guided notes for Measurement and Data that are designed to help your students thrive and save you the time and energy of writing and designing them yourself? These NO PREP guided notes are a classroom-proven resource that will have your students proficient in entire 5th grade math measurement and data common core standards. With a comprehensive design, these notes offer a structured approach that can be differentiated for every level of learner for the entire unit. Save 2
Subjects:
Grades:
4th - 6th
Create a Line Plot Project
Looking to assess line plots? Look no further!This project incorporates learning targets, skills, collaboration, and technology.Directions: With a partner, create a question used to collect data from your classmates. (Examples: In inches, how long is your hand? In cm, what is the circumference of your head? etc.) Then, create a line plot with your results. Use fraction intervals.Requirements:Create a reasonable question (Teacher approval required)Collect at least 20 pieces of dataCreate a line p
Subjects:
Grades:
4th - 6th
Types:
CCSS:
Also included in: Upper Grade Math Projects
Super Bowl Math - 2024 Edition
UPDATED for 2024!New - Bundle includes original Superbowl Math templates and Superbowl Math Cheat Sheets / Quick Version. Also new, Superbowl Timeline template.Target Grade Levels: 4-8 gradeTired of the same old data probability activities involving flipping coins and rolling a number cube?Try using a real-life application using a subject that get students, especially boys, interested in math!Have your students use real-life data/ stats to make a prediction about the Super Bowl winner!Students
Subjects:
Grades:
4th - 8th
Types:
Data Displays & Analysis Unit Bundle - Statistics - Distance Learning Compatible
This is a selection of my Data Displays & Analysis resources all in a money saving Essential Bundle! You save significant money and time versus purchasing these separately!Essential Bundles are designed to give you everything you need to rock your unit. Warmups, Notes, Activities, Games, Exit Tickets, and Tests. You will find a selection of my Drive Instruction, Escapes, Boot Camp, Adventures, Whodunnits, CSI, Person Puzzles, STEM-ersions, Herowork, TableTop and my 21st Century Math Projects
Subjects:
Grades:
5th - 9th
Types:
CCSS:
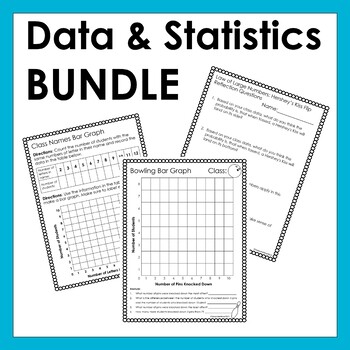
BUNDLE:Graphing, Probability, Data Collecting Activities/Stations Middle School
7-Activity/Station Data Day This download includes seven different data and statistics activities. These activities promote math group discussions, team work, and creativity in mathematics and great for students who are visual and hands on learners. Activity #1: Name Bar GraphsTeach your students about bar graphs by creating a class wide bar graph using your student’s names. This download provides directions as well as student work pages to graph the names of their classmates. Needed Materials
Subjects:
Grades:
5th - 8th
Types:
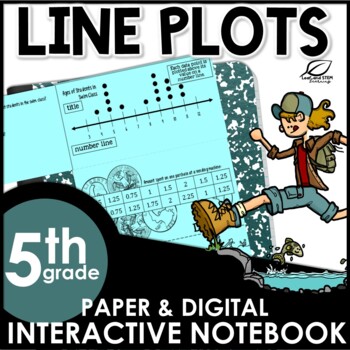
Line Plots or Dot Plots Interactive Notebook Set | Distance Learning
Whether you use the term line plots or dot plots, this interactive notebook set is perfect for introducing, creating, and analyzing data displayed on a number line! Use whole number, decimal, and fraction data to create and analyze line plots. Practice one and two step problem solving with data displayed on line plots or dot plots. This set includes a flip book, two practice games, two problem solving questions, and a four question test prep style assessment aligned to the Texas TEKS and Comm
Subjects:
Grades:
5th
CCSS:
Also included in: 5th Grade Math Interactive Notebook - ALL TEKS - ALL CCSS
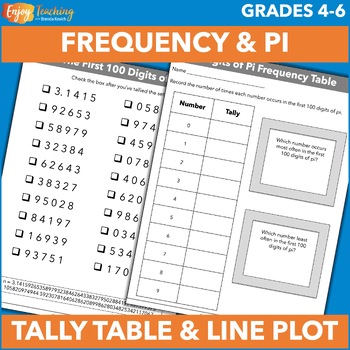
Pi Day Math Activity - Tally Tables, Frequency Tables & Line Plots
Analyze the first 100 digits of pi! Kids organize raw data on tally and frequency tables. Then they create line plots and see which numbers appear most often. It’s a great math activity for Pi Day – or anytime!Open the preview to take a closer look at this upper elementary project.First, teach or review simple data analysis strategies. Three instructional pages make it easy.Using a simple example, kids learn how to use hash marks to organize raw data in a tally table.Then they see how easy it is
Subjects:
Grades:
4th - 6th
Types:
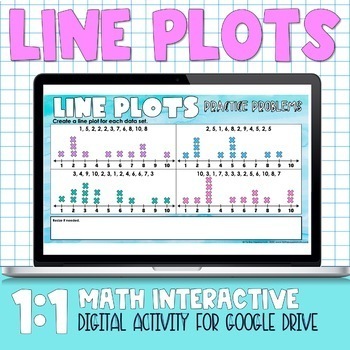
Line Plot Digital Practice Activity
Line Dot Plot Digital Practice ActivityThis product is a Google Slides product- students can complete it digitally. Included in this product: -8 different line plots problems- students have to drag and drop to create dot plots-Answer KeysCheck out my other Distance Learning Digital Products Here
Subjects:
Grades:
6th - 7th
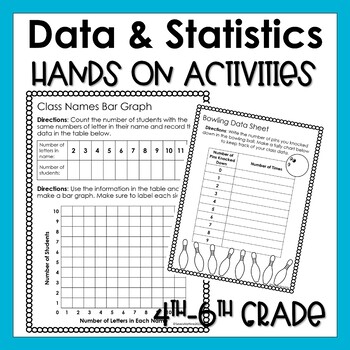
Data Day:Bar Graph:Line Plot:Graphing 4th, 5th, 6th Grade Hands on Activities
3-Activity Data Day This download includes three different data and statistics activities. These activities promote math group discussions, team work, and creativity in mathematics and great for students who are visual and hands on learners. Activity #1: Name Bar GraphsTeach your students about bar graphs by creating a class wide bar graph using your student’s names. This download provides directions as well as student work pages to graph the names of their classmates. Needed Materials outside
Subjects:
Grades:
4th - 6th
Types:
Showing 1-24 of 94 results


