TPT
Total:
$0.00

Spreadsheets and Graphing for Beginners - School Lunch

Rated 4.94 out of 5, based on 18 reviews
4.9 (18 ratings)
;
That Tech Chick
3.1k Followers
Resource Type
Standards
Formats Included
  • PDF
  • Excel Spreadsheets
Pages
9 pages
$3.25
$3.25
Share this resource
Report this resource to TPT
That Tech Chick
3.1k Followers
Also included in
  1. Tons of Google Classroom Resources<Please email me at nancy@thattechchicktpt.com if you have any questions!Thank you for your purchase,Nancy
    Price $39.20Original Price $49.00Save $9.80

Description

A Great Activity for Beginners!

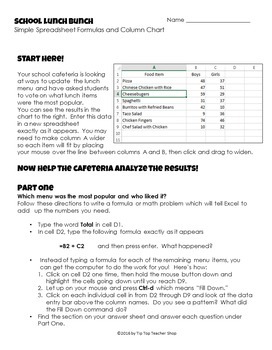
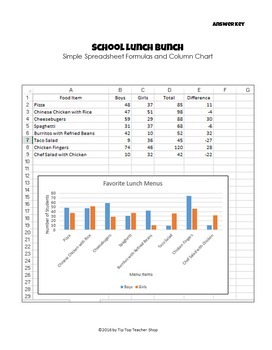
Enhance your students' developing knowledge of spreadsheets with this high interest activity. Students will key data from a poll of favorite school cafeteria menu items, create two simple formulas and create a simple column chart.

Included are:

*Teacher lesson plan with ISTE and Common Core objectives aligned;

*Attractive 2 page set of questions and directions for students;

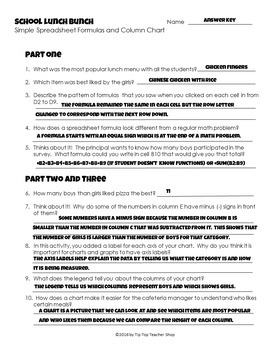
*Answer key

***************************************************************************

More Spreadsheet products you may be interested in:

Intro to Spreadsheets--School Lunch Bunch

Intro to Spreadsheets--Planning a Picnic Budget

How Old are You on Other Planets?

Trick or Treat! Halloween Computer Graphing for Kids

Fast Food Breakfast--Spreadsheet and Graphing Activity

Copyright 2016 by That Tech Chick

Purchase of this product is for single classroom use by the purchaser only. It is a violation for individuals, schools, and districts to redistribute, edit, sell, or post this item on the internet or to other individuals.

Total Pages
9 pages
Answer Key
Included
Teaching Duration
90 minutes
Report this resource to TPT
Reported resources will be reviewed by our team. Report this resource to let us know if this resource violates TPT’s content guidelines.

Standards

to see state-specific standards (only available in the US).
Make a line plot to display a data set of measurements in fractions of a unit (1/2, 1/4, 1/8). Solve problems involving addition and subtraction of fractions by using information presented in line plots. For example, from a line plot find and interpret the difference in length between the longest and shortest specimens in an insect collection.
Make a line plot to display a data set of measurements in fractions of a unit (1/2, 1/4, 1/8). Use operations on fractions for this grade to solve problems involving information presented in line plots. For example, given different measurements of liquid in identical beakers, find the amount of liquid each beaker would contain if the total amount in all the beakers were redistributed equally.

Reviews

Questions & Answers

3.1k Followers