4 results
Environment Common Core 7.SP.A.1 resources
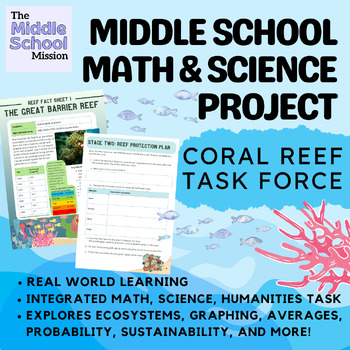
Middle School Maths Science Project: Coral Reef Task Force
The 'Coral Reef Task Force' needs the help of your students! Learn science, maths, and humanities concepts in an integrated real-world project.This integrated task combines science, maths, and humanities concepts in an engaging real-world scenario. Students join the 'Coral Reef Task Force' as scientists working to make recommendations about improving the health of the reef ecosystem. The three stages of the project include discovering more about the reef ecosystem (Science), analyzing data about
Subjects:
Grades:
7th - 9th
Types:
NGSS:
HS-LS2-3
, HS-LS2-7
, MS-LS2-3
, MS-LS2-5
, MS-LS2-4
...
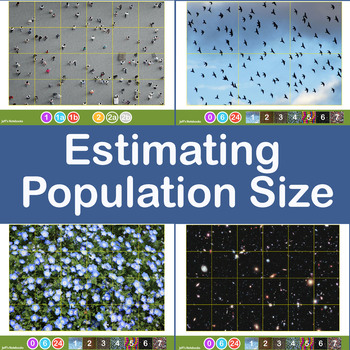
Estimating Crowd and Population Size using Jacob's Method
This investigation delves into estimating the size of a large population of objects by taking a sample and applying some basic mathematics. It encourages sharing of data, refining methods of collection of the data and discussion about the accuracy and limitations of the method used.Jacob's Method of counting large numbers of objects is simple. Draw a grid dividing the area covered into equal size squares. Estimate (by counting) the population of one grid then multiply this by the number of squar
Subjects:
Grades:
6th - 11th, Higher Education, Adult Education
Making Meaning of Data Using Basic Statistics – Plus Statistics with EXCEL
This learning unit includes two files – a PDF document and a PowerPoint presentation. The PDF includes the following components and can be used solely by the teacher or modified to remove the assessment pieces and distributed to the students. 1. Goals and Objectives2. Background Information a. Data Distribution, Descriptive Statistics, T-tests, and Error Barsb. EXCEL Software Use3. Assessmentsa. Exit Slip and Exit Slip Answer Keyb. Creative Component with Answer Key All of the background info
Subjects:
Grades:
7th - 10th
CCSS:
Experimental Variables and Graphing
This learning unit includes two files – a PDF document and a PowerPoint presentation. The PDF includes the following components and can be used solely by the teacher or modified to remove the assessment pieces and distributed to the students. 1. Goals and Objectives2. Background Information a. Variables, Components of a Graph, Graph Typesb. EXCEL Software Use3. Assessmentsa. Exit Slip and Exit Slip Answer Keyb. Quiz on Variables and Answer keyc. Creative Component Options A with Answer Key and
Subjects:
Grades:
7th - 9th
CCSS:
Showing 1-4 of 4 results


